Intraday Pivot Highs & Lows (Asia London NY)Intraday Pivot Highs & Lows (Asia London NY)
Script Description
This TradingView indicator is optimized for Forex, scalping, intraday, and day trading strategies. It accurately plots Pivot Points and levels, high/low, support and resistance levels. These are clearly identified to aid the trader during killzone sessions and session opens. Ideal for scalp trading, intraday sessions, and leveraging SMT (Smart Money Techniques). Utilize these Price Levels effectively during London Open, NY Open, and the Asia Session, utilizing Market Structure to pinpoint key levels and reversal zones for successful trading. Improve your Trade Setups, recognize reliable Chart Patterns, identify critical Price Pivots, and trade confidently off Institutional Levels.
This script marks the intraday pivot highs, lows and midpoints retracement levels for
Asia
London
New York
It also plots the previous day's high, low, midpoint, and 0.618 Fibonacci retracement levels, providing traders with critical price reference points for making intraday trading decisions.
Originality & Usefulness
This indicator uniquely integrates pivot calculations across three major Forex sessions (Asia, London, NY), clearly delineating session boundaries.
It enhances visibility by using distinct styling
solid for New York
dashed for London
dotted lines for Asia
And colour co-ordinated labeling, improving traders' ability to identify important intraday price action zones efficiently. Unlike standard pivot indicators, this script emphasizes session-specific trading dynamics.
### Key Features ###
Session-Based Levels: Automatically plots high, low, midpoint, and Fibonacci (.618) levels for each major session (Asia, London, NY).
Distinct Visual Cues: Lines and labels use session-specific styles and colors to easily differentiate between sessions.
Previous Day Reference: Clearly plots and labels yesterday's high, low, midpoint, and Fibonacci levels.
Flexible Visibility: Traders can set timeframe visibility to maintain clean charts on higher timeframes.
### How It Works
At the start of next day's session, previous session lines are cleared, ensuring the chart remains uncluttered.
High, low, midpoint, and Fibonacci retracement levels (.618) are dynamically calculated and displayed at the close of each session.
All session levels remain visible until the start of the next respective session, providing continuous actionable insights.
Trading Application:
Session highs and lows act as strong intraday support and resistance zones.
Midpoints and Fibonacci levels are effective for identifying potential reversal zones and retracements.
Daily levels provide a broader context, useful for gauging intraday volatility and range.
### Limitations and Considerations ##
Best used on liquid assets with clear session-based price action, such as Forex major pairs, if used on indexes make sure they contain 24 hour price action not just New York session.
This indicator is designed to streamline intraday trading by clearly marking essential pivot points and session-based levels, significantly improving traders' market context and decision-making accuracy. Can be used to enhance SMT decision making when scalping killzones.
在脚本中搜索"session high"

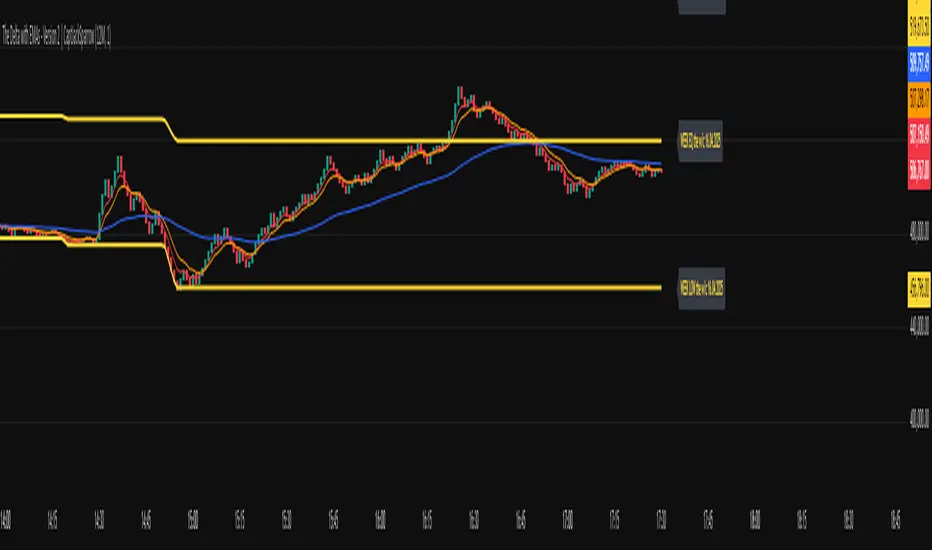
The Delta with EMAs - Version 2 | CaptJackSparrow📊 The Delta with EMAs - Version 2 16th April 25 working copy it is not finished yet!!!!!!!| CaptJackSparrow
This updated script takes your trading to the next level by merging dynamic volume delta with customizable EMAs and Fibonacci levels, all enhanced with session-based background highlights.
🧩 Cumulative Volume Delta (CVD):
Visualize market sentiment and volume flow with step-line candles, showing the tug-of-war between buyers and sellers.
Real-time tracking of volume dynamics with customizable timeframes and session-specific calculations.
📈 Exponential Moving Averages (EMAs):
EMAs (3, 5, 8, 9, 15, 24, 30, 60, 90) plotted on CVD to reveal trend direction and momentum shifts.
Customizable visibility settings for each EMA, with background coloring when the EMAs align to highlight momentum zones.
📊 Fibonacci Levels:
Overnight and New York sessions: Track the high, low, and midpoint (equilibrium) for each session to gauge market sentiment.
Weekly Fibonacci: See the high, low, and midpoint for the week, with dynamic labels updating as the week progresses.
🌍 Session Highlights:
Display colored backgrounds for New York, Overnight, Europe, Asia, and After Hours sessions, helping you identify active market periods.
Customizable start/end times for each session with visual color options.
🔔 Alerts & Visuals:
EMA crossovers and background colors help spot key momentum shifts.
Tailored alerts based on the crossover of the EMAs, helping you track potential entries or exits.
🧠 Ideal for traders who love:
Understanding market structure through volume analysis.
Using multiple session contexts for more precise trading decisions.
Anticipating breakouts or divergences with dynamic Fibonacci and EMA support.
🏴☠️ Disclaimer: This script is for educational purposes only and is not financial advice. Always trade responsibly and consider market risks.
Globex time (New York Time)This indicator is designed to highlight and analyze price movements within the Globex session. Primarily geared toward the Globex Trap trading strategy, this tool visually identifies the session's high and low prices, allowing traders to better assess price action during extended hours. Here’s a comprehensive breakdown of its features and functionality:
Purpose
The "Globex Time (New York Time)" indicator tracks price levels during the Globex trading session, providing a clear view of overnight market activity. This session, typically running from 6 p.m. ET (18:00) until the following morning at 8:30 a.m. ET, is a critical period where significant market positioning can occur before the regular session opens. In the Globex Trap strategy, the session high and low are essential levels, as price movements around these areas often indicate potential support, resistance, or reversal zones, which traders use to set up entries or exits when the regular trading session begins.
Key Features
Customizable Session Start and End Times
The indicator allows users to specify the exact start and end times of the Globex session in New York time. The default settings are:
Start: 6 p.m. ET (18:00)
End: 8:30 a.m. ET
These settings can be adjusted to align with specific market hours or personal preferences.
Session High and Low Identification
Throughout the defined session, the indicator dynamically calculates and tracks:
Session High: The highest price reached within the session.
Session Low: The lowest price reached within the session.
These levels are essential for the Globex Trap strategy, as price action around them can indicate likely breakout or reversal points when regular trading resumes.
Vertical Lines for Session Start and End
The indicator draws vertical lines at both the session start and end times:
Session Start Line: A solid line marking the exact beginning of the Globex session.
Session End Line: A similar vertical line marking the session’s conclusion.
Both lines are customizable in terms of color and thickness, making it easy to distinguish the session boundaries visually on the chart.
Horizontal Lines for Session High and Low
At the end of the session, the indicator plots horizontal lines representing the Globex session's high and low levels. Users can customize these lines:
Color: Define specific colors for the session high (default: red) and session low (default: green) to easily differentiate them.
Line Style: Options to set the line style (solid, dashed, or dotted) provide flexibility for visual preferences and chart organization.
Automatic Reset for Daily Tracking
To adapt to the next trading day, the indicator resets the session high and low data once the current session ends. This reset prepares it to start tracking new levels at the beginning of the next session without manual intervention.
Practical Application in the Globex Trap Strategy
In the Globex Trap strategy, traders are primarily interested in price behavior around the high and low levels established during the overnight session. Common applications of this indicator for this strategy include:
Breakout Trades: Watching for price to break above the Globex high or below the Globex low, indicating potential momentum in the breakout direction.
Reversal Trades: Monitoring for failed breakouts or traps where price tests and rejects the Globex high or low, suggesting a reversal as liquidity is trapped in these zones.
Support and Resistance Zones: Using the session high and low as key support and resistance levels during the regular trading session, with potential entry or exit points when price approaches these areas.
Additional Configuration Options
Vertical Line Color and Width: Define the color and thickness of the vertical session start and end lines to match your chart’s theme.
Upper and Lower Line Colors and Styles: Customize the appearance of the session high and low horizontal lines by setting color and line style (solid, dashed, or dotted), making it easy to distinguish these critical levels from other chart markings.
Summary
This indicator is a valuable tool for traders implementing the Globex Trap strategy. It visually segments the Globex session and marks essential price levels, helping traders analyze market behavior overnight. Through its customizable options and clear visual representation, it simplifies tracking overnight price activity and identifying strategic levels for potential trade setups during the regular session.

ICT Master Suite [Trading IQ]Hello Traders!
We’re excited to introduce the ICT Master Suite by TradingIQ, a new tool designed to bring together several ICT concepts and strategies in one place.
The Purpose Behind the ICT Master Suite
There are a few challenges traders often face when using ICT-related indicators:
Many available indicators focus on one or two ICT methods, which can limit traders who apply a broader range of ICT related techniques on their charts.
There aren't many indicators for ICT strategy models, and we couldn't find ICT indicators that allow for testing the strategy models and setting alerts.
Many ICT related concepts exist in the public domain as indicators, not strategies! This makes it difficult to verify that the ICT concept has some utility in the market you're trading and if it's worth trading - it's difficult to know if it's working!
Some users might not have enough chart space to apply numerous ICT related indicators, which can be restrictive for those wanting to use multiple ICT techniques simultaneously.
The ICT Master Suite is designed to offer a comprehensive option for traders who want to apply a variety of ICT methods. By combining several ICT techniques and strategy models into one indicator, it helps users maximize their chart space while accessing multiple tools in a single slot.
Additionally, the ICT Master Suite was developed as a strategy . This means users can backtest various ICT strategy models - including deep backtesting. A primary goal of this indicator is to let traders decide for themselves what markets to trade ICT concepts in and give them the capability to figure out if the strategy models are worth trading!
What Makes the ICT Master Suite Different
There are many ICT-related indicators available on TradingView, each offering valuable insights. What the ICT Master Suite aims to do is bring together a wider selection of these techniques into one tool. This includes both key ICT methods and strategy models, allowing traders to test and activate strategies all within one indicator.
Features
The ICT Master Suite offers:
Multiple ICT strategy models, including the 2022 Strategy Model and Unicorn Model, which can be built, tested, and used for live trading.
Calculation and display of key price areas like Breaker Blocks, Rejection Blocks, Order Blocks, Fair Value Gaps, Equal Levels, and more.
The ability to set alerts based on these ICT strategies and key price areas.
A comprehensive, yet practical, all-inclusive ICT indicator for traders.
Customizable Timeframe - Calculate ICT concepts on off-chart timeframes
Unicorn Strategy Model
2022 Strategy Model
Liquidity Raid Strategy Model
OTE (Optimal Trade Entry) Strategy Model
Silver Bullet Strategy Model
Order blocks
Breaker blocks
Rejection blocks
FVG
Strong highs and lows
Displacements
Liquidity sweeps
Power of 3
ICT Macros
HTF previous bar high and low
Break of Structure indications
Market Structure Shift indications
Equal highs and lows
Swings highs and swing lows
Fibonacci TPs and SLs
Swing level TPs and SLs
Previous day high and low TPs and SLs
And much more! An ongoing project!
How To Use
Many traders will already be familiar with the ICT related concepts listed above, and will find using the ICT Master Suite quite intuitive!
Despite this, let's go over the features of the tool in-depth and how to use the tool!
The image above shows the ICT Master Suite with almost all techniques activated.
ICT 2022 Strategy Model
The ICT Master suite provides the ability to test, set alerts for, and live trade the ICT 2022 Strategy Model.
The image above shows an example of a long position being entered following a complete setup for the 2022 ICT model.
A liquidity sweep occurs prior to an upside breakout. During the upside breakout the model looks for the FVG that is nearest 50% of the setup range. A limit order is placed at this FVG for entry.
The target entry percentage for the range is customizable in the settings. For instance, you can select to enter at an FVG nearest 33% of the range, 20%, 66%, etc.
The profit target for the model generally uses the highest high of the range (100%) for longs and the lowest low of the range (100%) for shorts. Stop losses are generally set at 0% of the range.
The image above shows the short model in action!
Whether you decide to follow the 2022 model diligently or not, you can still set alerts when the entry condition is met.
ICT Unicorn Model
The image above shows an example of a long position being entered following a complete setup for the ICT Unicorn model.
A lower swing low followed by a higher swing high precedes the overlap of an FVG and breaker block formed during the sequence.
During the upside breakout the model looks for an FVG and breaker block that formed during the sequence and overlap each other. A limit order is placed at the nearest overlap point to current price.
The profit target for this example trade is set at the swing high and the stop loss at the swing low. However, both the profit target and stop loss for this model are configurable in the settings.
For Longs, the selectable profit targets are:
Swing High
Fib -0.5
Fib -1
Fib -2
For Longs, the selectable stop losses are:
Swing Low
Bottom of FVG or breaker block
The image above shows the short version of the Unicorn Model in action!
For Shorts, the selectable profit targets are:
Swing Low
Fib -0.5
Fib -1
Fib -2
For Shorts, the selectable stop losses are:
Swing High
Top of FVG or breaker block
The image above shows the profit target and stop loss options in the settings for the Unicorn Model.
Optimal Trade Entry (OTE) Model
The image above shows an example of a long position being entered following a complete setup for the OTE model.
Price retraces either 0.62, 0.705, or 0.79 of an upside move and a trade is entered.
The profit target for this example trade is set at the -0.5 fib level. This is also adjustable in the settings.
For Longs, the selectable profit targets are:
Swing High
Fib -0.5
Fib -1
Fib -2
The image above shows the short version of the OTE Model in action!
For Shorts, the selectable profit targets are:
Swing Low
Fib -0.5
Fib -1
Fib -2
Liquidity Raid Model
The image above shows an example of a long position being entered following a complete setup for the Liquidity Raid Modell.
The user must define the session in the settings (for this example it is 13:30-16:00 NY time).
During the session, the indicator will calculate the session high and session low. Following a “raid” of either the session high or session low (after the session has completed) the script will look for an entry at a recently formed breaker block.
If the session high is raided the script will look for short entries at a bearish breaker block. If the session low is raided the script will look for long entries at a bullish breaker block.
For Longs, the profit target options are:
Swing high
User inputted Lib level
For Longs, the stop loss options are:
Swing low
User inputted Lib level
Breaker block bottom
The image above shows the short version of the Liquidity Raid Model in action!
For Shorts, the profit target options are:
Swing Low
User inputted Lib level
For Shorts, the stop loss options are:
Swing High
User inputted Lib level
Breaker block top
Silver Bullet Model
The image above shows an example of a long position being entered following a complete setup for the Silver Bullet Modell.
During the session, the indicator will determine the higher timeframe bias. If the higher timeframe bias is bullish the strategy will look to enter long at an FVG that forms during the session. If the higher timeframe bias is bearish the indicator will look to enter short at an FVG that forms during the session.
For Longs, the profit target options are:
Nearest Swing High Above Entry
Previous Day High
For Longs, the stop loss options are:
Nearest Swing Low
Previous Day Low
The image above shows the short version of the Silver Bullet Model in action!
For Shorts, the profit target options are:
Nearest Swing Low Below Entry
Previous Day Low
For Shorts, the stop loss options are:
Nearest Swing High
Previous Day High
Order blocks
The image above shows indicator identifying and labeling order blocks.
The color of the order blocks, and how many should be shown, are configurable in the settings!
Breaker Blocks
The image above shows indicator identifying and labeling order blocks.
The color of the breaker blocks, and how many should be shown, are configurable in the settings!
Rejection Blocks
The image above shows indicator identifying and labeling rejection blocks.
The color of the rejection blocks, and how many should be shown, are configurable in the settings!
Fair Value Gaps
The image above shows indicator identifying and labeling fair value gaps.
The color of the fair value gaps, and how many should be shown, are configurable in the settings!
Additionally, you can select to only show fair values gaps that form after a liquidity sweep. Doing so reduces "noisy" FVGs and focuses on identifying FVGs that form after a significant trading event.
The image above shows the feature enabled. A fair value gap that occurred after a liquidity sweep is shown.
Market Structure
The image above shows the ICT Master Suite calculating market structure shots and break of structures!
The color of MSS and BoS, and whether they should be displayed, are configurable in the settings.
Displacements
The images above show indicator identifying and labeling displacements.
The color of the displacements, and how many should be shown, are configurable in the settings!
Equal Price Points
The image above shows the indicator identifying and labeling equal highs and equal lows.
The color of the equal levels, and how many should be shown, are configurable in the settings!
Previous Custom TF High/Low
The image above shows the ICT Master Suite calculating the high and low price for a user-defined timeframe. In this case the previous day’s high and low are calculated.
To illustrate the customizable timeframe function, the image above shows the indicator calculating the previous 4 hour high and low.
Liquidity Sweeps
The image above shows the indicator identifying a liquidity sweep prior to an upside breakout.
The image above shows the indicator identifying a liquidity sweep prior to a downside breakout.
The color and aggressiveness of liquidity sweep identification are adjustable in the settings!
Power Of Three
The image above shows the indicator calculating Po3 for two user-defined higher timeframes!
Macros
The image above shows the ICT Master Suite identifying the ICT macros!
ICT Macros are only displayable on the 5 minute timeframe or less.
Strategy Performance Table
In addition to a full-fledged TradingView backtest for any of the ICT strategy models the indicator offers, a quick-and-easy strategy table exists for the indicator!
The image above shows the strategy performance table in action.
Keep in mind that, because the ICT Master Suite is a strategy script, you can perform fully automatic backtests, deep backtests, easily add commission and portfolio balance and look at pertinent metrics for the ICT strategies you are testing!
Lite Mode
Traders who want the cleanest chart possible can toggle on “Lite Mode”!
In Lite Mode, any neon or “glow” like effects are removed and key levels are marked as strict border boxes. You can also select to remove box borders if that’s what you prefer!
Settings Used For Backtest
For the displayed backtest, a starting balance of $1000 USD was used. A commission of 0.02%, slippage of 2 ticks, a verify price for limit orders of 2 ticks, and 5% of capital investment per order.
A commission of 0.02% was used due to the backtested asset being a perpetual future contract for a crypto currency. The highest commission (lowest-tier VIP) for maker orders on many exchanges is 0.02%. All entered positions take place as maker orders and so do profit target exits. Stop orders exist as stop-market orders.
A slippage of 2 ticks was used to simulate more realistic stop-market orders. A verify limit order settings of 2 ticks was also used. Even though BTCUSDT.P on Binance is liquid, we just want the backtest to be on the safe side. Additionally, the backtest traded 100+ trades over the period. The higher the sample size the better; however, this example test can serve as a starting point for traders interested in ICT concepts.
Community Assistance And Feedback
Given the complexity and idiosyncratic applications of ICT concepts amongst its proponents, the ICT Master Suite’s built-in strategies and level identification methods might not align with everyone's interpretation.
That said, the best we can do is precisely define ICT strategy rules and concepts to a repeatable process, test, and apply them! Whether or not an ICT strategy is trading precisely how you would trade it, seeing the model in action, taking trades, and with performance statistics is immensely helpful in assessing predictive utility.
If you think we missed something, you notice a bug, have an idea for strategy model improvement, please let us know! The ICT Master Suite is an ongoing project that will, ideally, be shaped by the community.
A big thank you to the @PineCoders for their Time Library!
Thank you!

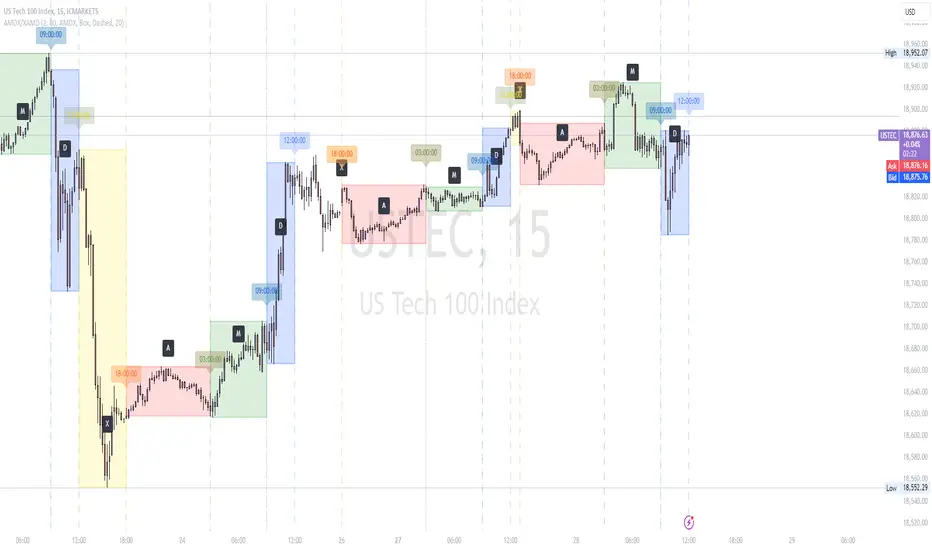
AMDX/XAMD indicatorThe AMDX/XAMD indicator is designed to highlight specific trading sessions on the chart using distinct colors and optional vertical lines. Users can choose between two session types, AMDX or XAMD, and customize the visual appearance of the sessions. This tool is particularly useful for traders who want to analyze market behavior during different trading periods.
Meaning of AMDX:
A: Accumulation
M: Manipulation
D: Distribution
X: Continuation Or Reversal
Features:
Session Highlighting:
AMDX Sessions: Split into four segments - A, M, D, X.
XAMD Sessions: Split into four segments - X, A, M, D.
Customizable Colors:
Choose individual colors for each session (A, M, D, X).
Adjust the transparency of the session boxes for better visual integration with the chart.
Drawing Styles:
Box Style: Draws colored boxes around the session ranges.
Line Style: Draws vertical lines at session start and end times.
Vertical Lines:
Option to enable or disable vertical lines at session boundaries.
Customizable line style: Solid, Dotted, or Dashed.
Session Labels:
Automatically labels each session for easy identification.
Customization Options:
Session Type: Select between AMDX and XAMD session types.
Colors: Set custom colors for each session and vertical lines.
Border Width: Adjust the width of the session box borders.
Transparency: Control the transparency level of the session boxes.
Drawing Style: Choose between Box and Line styles for session representation.
Vertical Lines: Enable or disable vertical lines and select the line style.
How It Works:
The indicator calculates the start and end times for each session based on the selected session type (AMDX or XAMD). It then draws either boxes or lines to highlight these sessions on the chart. The indicator also includes options to draw vertical lines at the session boundaries and labels each session with a corresponding letter (A, M, D, X).
Use Cases:
Market Session Analysis: Easily identify and analyze market behavior during different trading sessions.
Intraday Trading: Helps intraday traders to focus on specific time segments of the trading day.
Visual Segmentation: Provides a clear visual segmentation of the trading day, aiding in better decision-making.
Times for AMDX/XAMD session:
A Session: 18:00 (previous day) to 03:00 (current day)
M Session: 03:00 to 09:00
D Session: 09:00 to 12:00
X Session: 12:00 to 18:00
Time for the XAMD session :
X Session: 18:00 (previous day) to 00:00 (current day)
A Session: 00:00 to 09:00
M Session: 09:00 to 12:00
D Session: 12:00 to 18:00
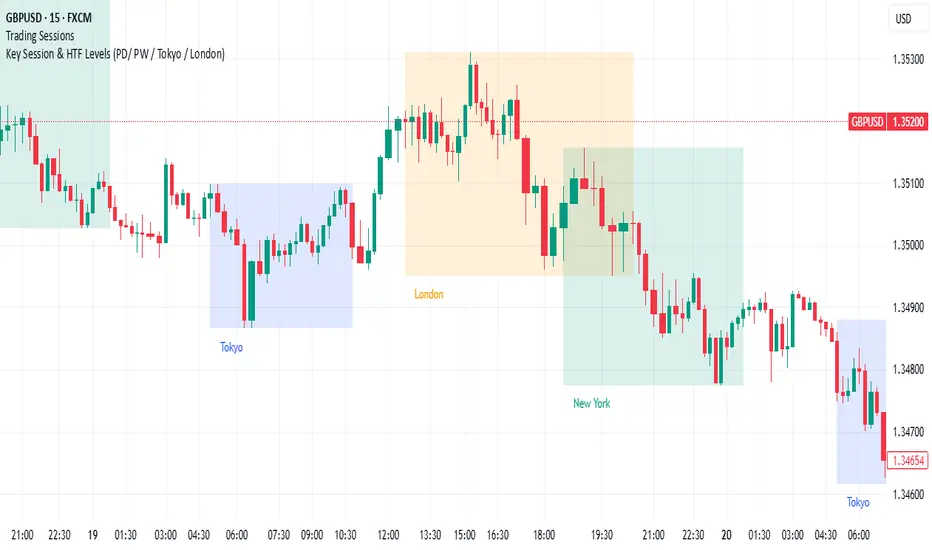
Diddly - Charts (Asian, London & New York Session + Weekdays)Overview:
Diddly Charts is for providing intraday context to where we are in the market. It does this through a series of ranges displayed throughout the day, typically broken down into the Asian, London, and New York sessions.
This indicator also highlights key market structures like monthly, weekly, and previous day's highs and lows. Lines are provided for weekday and weekend separators, with the days of the week at the bottom of the chart, making it extremely useful for traders when identifying weekly cycles.
Usage:
All aspects of this indicator are changeable within the settings, allowing you to utilise the elements that are most important to your trading strategy.
The default layout is extremely useful for currency pairs, where traders use the London and New York boxes as windows of when to engage with the market. The times of these trading sessions can be changed to suit the trading periods that you want to trade.
Adhering to trading windows can help improve discipline to ensure that you are only taking entries within the time periods that match your trading strategy.
Some traders prefer a cleaner interface and don't want any indicator to detract from the price action they are reading, this can be achieved through changing the colour and their transparency in settings. In this example, you will see different labels used to annotate key structures, these can be changed to something that is relevant to your strategy in the settings.
It can also be used for trading Stocks where sessions are broken down into pre-market, market hours and post-market. This can be helpful to see those stocks that breakout of pre-market session highs and lows and also provide trading windows to keep traders out of trades that do not comply with their trading strategy.
Using higher time frames like a 4 hour chart or even the 1 hour chart, the intraday sessions are hidden away so traders can get a broader perspective without the clutter when zooming out. Although there are options to turn it on if you would prefer.
Here on a zoomed out 1 hour chart we have the option to only display the weekly line separator, which can help get an overview of weekly cycles.
Helpful Information
The main setting that you may want to change is at the top of the indicator settings, which is asking "what asset type" is the symbol being looked at. The indicator needs to know how to display the session range information. For example for currencies, the range size will be displayed in pips. For stocks or Futures it would display the financial amount. Beyond the visual display of information, this setting has no other impact on the indicator behaviour. The default setting is "Currencies".
We often get asked what the labels that appear on the chart mean. These can all be changed to your requirements, but by default what you will see when you apply the indicator to the chart is:
Under the Asian Range appears a couple of labels.
A = x : This is the range size of the session in pips for forex or amount for other assets, from the lowest to the highest price traded during that window.
ADR = y : This is the Average Daily Range over the last 21 days for this ticker
Under the London and New York session you will see a L = x or NY = y . This is the range size of each session in pips for forex or amount for other assets.
Structure Labels
YH = Yesterday's High
YL = Yesterday's Low
WH = Current Week's High
WL = Current Week's Low
MH = Current Month's High
ML = Current Month's Low
We greatly appreciate the support and feedback from the Trading View community, and we are dedicated to continuing to improve our indicators with your support.
We want to help you manage risk, and that's why we emphasise that trading is risky and any technology used to support our trading decisions is based on information from the past. We encourage traders to take responsibility for their trading businesses and always prioritise risk management.

Session candles & reversals / quantifytools— Overview
Like traditional candles, session based candles are a visualization of open, high, low and close values, but based on session time periods instead of typical timeframes such as daily or weekly. Session candles are formed by fetching price at session start (open), highest price during session (high), lowest price during session (low) and price at session end (close). On top of candles, session based moving average is formed and session reversals detected. Session reversals are also backtested, using win rate and magnitude metrics to better understand what to expect from session reversals and which ones have historically performed the best.
By default, following session time periods are used:
Session #1: London (08:00 - 17:00, UTC)
Session #2: New York (13:00 - 22:00, UTC)
Session #3: Sydney (21:00 - 06:00, UTC)
Session #4: Tokyo (00:00 - 09:00, UTC)
Session time periods can be changed via input menu.
— Reversals
Session reversals are patterns that show a rapid change in direction during session. These formations are more familiarly known as wicks or engulfing candles. Following criteria must be met to qualify as a session reversal:
Wick up:
Lower high, lower low, close >= 65% of session range (0% being the very low, 100% being the very high) and open >= 40% of session range.
Wick down:
Higher high, higher low, close <= 35% of session range and open <= 60% of session range.
Engulfing up:
Higher high, lower low, close >= 65% of session range.
Engulfing down:
Higher high, lower low, close <= 35% of session range.
Session reversals are always based on prior corresponding session , e.g. to qualify as a NY session engulfing up, NY session must have a higher high and lower low relative to prior NY session , not just any session that has taken place in between. Session reversals should be viewed the same way wicks/engulfing formations are viewed on traditional timeframe based candles. Essentially, wick reversals (light green/red labels) tell you most of the motion during session was reversed. Engulfing reversals (dark green/red labels) on the other hand tell you all of the motion was reversed and new direction set.
— Backtesting
Session reversals are backtested using win rate and magnitude metrics. A session reversal is considered successful when next corresponding session closes higher/lower than session reversal close . Win rate is formed by dividing successful session reversal count with total reversal count, e.g. 5 successful reversals up / 10 reversals up total = 50% win rate. Win rate tells us what are the odds (historically) of session reversal producing a clean supporting move that was persistent enough to close that way too.
When a session reversal is successful, its magnitude is measured using percentage increase/decrease from session reversal close to next corresponding session high/low . If NY session closes higher than prior NY session that was a reversal up, the percentage increase from prior session close (reversal close) to current session high is measured. If NY session closes lower than prior NY session that was a reversal down, the percentage decrease from prior session close to current session low is measured.
Average magnitude is formed by dividing all percentage increases/decreases with total reversal count, e.g. 10 total reversals up with 1% increase each -> 10% net increase from all reversals -> 10% total increase / 10 total reversals up = 1% average magnitude. Magnitude metric supports win rate by indicating the depth of successful session reversal moves.
To better understand the backtesting calculations and more importantly to verify their validity, backtesting visuals for each session can be plotted on the chart:
All backtesting results are shown in the backtesting panel on top right corner, with highest win rates and magnitude metrics for both reversals up and down marked separately. Note that past performance is not a guarantee of future performance and session reversals as they are should not be viewed as a complete strategy for long/short plays. Always make sure reversal count is sufficient to draw reliable conclusions of performance.
— Session moving average
Users can form a session based moving average with their preferred smoothing method (SMA , EMA , HMA , WMA , RMA) and length, as well as choose which sessions to include in the moving average. For example, a moving average based on New York and Tokyo sessions can be formed, leaving London and Sydney completely out of the calculation.
— Visuals
By default, script hides your candles/bars, although in the case of candles borders will still be visible. Switching to bars/line will make your regular chart visuals 100% hidden. This setting can be turned off via input menu. As some sessions overlap, each session candle can be separately offsetted forward, clearing the overlaps. Users can also choose which session candles to show/hide.
Session periods can be highlighted on the chart as a background color, applicable to only session candles that are activated. By default, session reversals are referred to as L (London), N (New York), S (Sydney) and T (Tokyo) in both reversal labels and backtesting table. By toggling on "Numerize sessions", these will be replaced with 1, 2, 3 and 4. This will be helpful when using a custom session that isn't any of the above.
Visual settings example:
Session candles are plotted in two formats, using boxes and lines as well as plotcandle() function. Session candles constructed using boxes and lines will be clear and much easier on the eyes, but will apply only to first 500 bars due to Tradingview related limitations. Rest of the session candles go back indefinitely, but won't be as clean:
All colors can be customized via input menu.
— Timeframe & session time period considerations
As a rule of thumb, session candles should be used on timeframes at or below 1H, as higher timeframes might not match with session period start/end, leading to incorrect plots. Using 1 hour timeframe will bring optimal results as greatest amount historical data is available without sacrificing accuracy of OHLC values. If you are using a custom session that is not based on hourly period (e.g. 08:00 - 15:00 vs. 08.00 - 15.15) make sure you are using a timeframe that allows correct plots.
Session time periods applied by default are rough estimates and might be out of bounds on some charts, like NYSE listed equities. This is rarely a problem on assets that have extensive trading hours, like futures or cryptocurrency. If a session is out of bounds (asset isn't traded during the set session time period) the script won't plot given session candle and its backtesting metrics will be NA. This can be fixed by changing the session time periods to match with given asset trading hours, although you will have to consider whether or not this defeats the purpose of having candles based on sessions.
— Practical guide
Whether based on traditional timeframes or sessions, reversals should always be considered as only one piece of evidence of price turning. Never react to them without considering other factors that might support the thesis, such as levels and multi-timeframe analysis. In short, same basic charting principles apply with session candles that apply with normal candles. Use discretion.
Example #1 : Focusing efforts on session reversals at distinct support/resistance levels
A reversal against a level holds more value than a reversal by itself, as you know it's a placement where liquidity can be expected. A reversal serves as a confirming reaction for this expectation.
Example #2 : Focusing efforts on highest performing reversals and avoiding poorly performing ones
As you have data backed evidence of session reversal performance, it makes sense to focus your efforts on the ones that perform best. If some session reversal is clearly performing poorly, you would want to avoid it, since there's nothing backing up its validity.
Example #3 : Reversal clusters
Two is better than one, three is better than two and so on. If there are rapid changes in direction within multiple sessions consecutively, there's heavier evidence of a dynamic shift in price. In such case, it makes sense to hold more confidence in price halting/turning.

Universal Po3 Profiler [Pro +] | cephxsUNIVERSAL Po3 PROFILER 🧪
All concepts used in the development of this indicator are open source and available to all on youtube.
Credits go out to Michael J. H. (ICT) as the one putting it out there for all.
A refined approach to multi-timeframe structural analysis. Clean visuals. Precise signals. Nothing more than what matters.
OVERVIEW
Built for traders who value clarity over complexity, this profiler distills institutional price delivery concepts into a visually cohesive overlay. It maps higher timeframe structure directly onto your chart while detecting key divergence patterns across correlated assets.
The design philosophy is intentional minimalism—every element earns its place on your chart. No redundant indicators. No visual noise. Just the structural context you need to frame your trading decisions.
📷 Full indicator overview showing HTF candles, CISD lines, and SMT divergences on a 5m YM chart
CORE FEATURES
🧪 Multi-Timeframe Profiling
Automatically profiles up to three higher timeframes based on your chart's resolution. The system intelligently selects appropriate HTF pairings—or lets you override with manual control. 0 stress, minimal input overload.
Auto Mode: Adapts HTF selection to your chart timeframe
Profiler Source: Choose which HTF defines your structural boundaries
Directional Bias: Filter profiling to bullish or bearish setups only
📷 Side-by-side comparison; Auto mode on 5m chart vs 15m chart showing different HTF selections
🔀 SMT DIVERGENCE DETECTION
Identifies Smart Money divergences between correlated assets in real-time. When the primary asset makes a structural move that correlated pairs fail to confirm by moving in-sync, the system flags potential reversals.
Tracks divergences across multiple HTF sessions
Supports both normal and inverse correlations
Independent chart and HTF candle visualization
Automatic invalidation when divergence resolves
Configurable asset pairs with correlation library integration that is updated regularly
📷 SMT divergence example, ES vs YM showing bearish divergence at session highs
📐 CISD DETECTION & FIBONACCI PROJECTIONS
Change in State of Delivery (CISD) marks the moment price starts to deliver in the opposing direction of where it previously went. The system identifies these pivotal transitions and projects optional Fibonacci extensions to map potential price targets.
Automatic stretch calculation from opposing candle sequences
Confirmation-based detection (not predictive)
Fibonacci projections with customizable levels (-1 to -4.5)
Size filtering to eliminate noise on smaller moves
Visual invalidation when structure breaks
📷 Confirmed CISD with Fibonacci projection levels (other features disabled to highlight)
📷 Multiple CISDs showing bullish and bearish examples simultaneously
🎯 MANIPULATION AREA PROFILING
Detects sweep-and-reversal sequences within HTF candle boundaries. The profiling system identifies when price sweeps the immediate previous candle's extreme then confirms directional commitment after a candle close.
How the manipulation area is calculated (it is not a magic level, it's a simple division : ) )
For C3 : is measured from the Open of C3 to the quadrant C.E of C2
For C4 : is measured from the Open of C4 to the Upper Quadrant (25/75) of C3.
All Based on openly-sourced ICT Concepts
Po3 area visualization on profiler HTF
Sweep line tracking at structural levels
C1/C2/C3 phase progression
Bias filtering for directional focus
📷 Manipulation area highlighting Po3 zone with sweep lines
HTF CANDLE VISUALIZATION
Projects higher timeframe candles to the right of your chart, providing structural context without cluttering price action. Full credit for the base logic used in building this goes to @fadizeidan.
Up to 3 HTF layers with independent candle counts
PSP (Precision Swing Point) divergence detection on candles
Clean, adjustable styling
Session labels with countdown timers
INPUTS
Directional Bias
Po3 Profiling Bias: Auto / Bullish / Bearish — filters manipulation area detection
CISD/SSMT Bias: Auto / Bullish / Bearish — filters divergence detection
HTF Configuration
Auto Mode: Enabled by default. Automatically configures HTF timeframes
HTF 1/2/3: Manual timeframe selection when Auto Mode disabled
Profiler Source: Which HTF defines profiling boundaries
SMT Settings
Enable SMT: Master toggle for divergence detection
Show on Chart: Render divergence lines on price chart
Show on HTF Candles: Render divergence lines on HTF candle visuals
Asset Selection: Configure correlated pairs and inversion settings
CISD Settings
Show CISD: Enable change in state detection
Fibonacci Projections: Enable extension level plotting
Level Configuration: Toggle individual fib levels (-1 through -4.5)
Profiler Status Bar
Position: 9 positions including center options
Styling: Size, bold toggle, custom colors
---
RECOMMENDED USAGE
Start with Auto Mode enabled to learn the HTF relationships
Set your directional bias if you have a higher timeframe thesis
Watch for SMT divergences at session extremes
Use CISD confirmations to identify structural shifts
Reference Fibonacci projections for potential targets
Optimal Timeframes:
Scalping: 1m-3m charts (profiles to 15m-90m)
Intraday: 5m-15m charts (profiles to 1H-4H / Optionally 6H)
Swing: 1H-4H charts (profiles to Daily-Weekly)
---
CORRELATED ASSETS
The SMT system works with major correlations including:
Index Futures: CME_MINI:ES1! , CME_MINI:NQ1! , CBOT_MINI:YM1!
Forex Majors: FOREXCOM:EURUSD , FOREXCOM:GBPUSD , TVC:DXY
Crypto: BINANCE:BTCUSDT , BINANCE:ETHUSDT
Crypto Futures: CME:BTC1! , CME:ETH1!
---
NOTES
This version does not include alert conditions. Visual-first design.
It will be easier to understand if you have a preliminary knowledge of the concepts beforehand
This is not a learning instrument on it's own and could have bugs, Know it for yourself so you can identify bugs if any.
---
DISCLAIMER
This indicator is provided for educational and analytical purposes only. It does not constitute financial advice, and no representation is made regarding future performance.
Trading involves substantial risk of loss. Always conduct your own analysis and use proper risk management. Past structural patterns do not guarantee future price behavior.
---
CREDITS
Inspiration and HTF candle plotting boilerplate: @fadizeidan
Asset correlation library: fstarcapital
Development: cephxs & fstarcapital
---
CHANGELOG
v1.0: Initial Pro+ release — SMT divergences, CISD detection, multi-HTF Po3 profiling

HTF/CTF High/Low Mitigation with SignalsHTF/CTF High/Low Mitigation with Signals Indicator
Overview
HTF/CTF High/Low Mitigation with Signals (shortened as "H/L Signals+") is an advanced overlay indicator for TradingView, designed to identify and visualize higher timeframe (HTF) and current timeframe (CTF) swing highs/lows, track their mitigation, and generate filtered buy/sell signals using an EMA ribbon trend filter. It incorporates automated trade simulation with risk/reward (RR) visualization, position sizing based on user-defined risk, and a statistics table for performance evaluation. This tool is ideal for multi-timeframe traders focusing on swing trading, breakout strategies, or trend reversals across assets like forex, futures, metals (e.g., XAU/USD, XAG/USD), stocks, or cryptocurrencies.
The "meshup" (mashup) integrates several complementary elements: Multi-timeframe swing level detection (HTF for broader structure, CTF for finer details) with mitigation logic ensures signals align with market structure breaks; an EMA ribbon provides a dynamic trend bias to filter counter-trend trades; risk management automates position sizing and RR calculations for disciplined trading; and built-in backtesting stats offer quick insights into hypothetical performance. This combination reduces noise from isolated indicators—e.g., raw swings can be choppy, EMAs alone lag structure, and manual RR is error-prone—creating a cohesive system for spotting high-probability setups where structure, trend, and risk align. By meshing these, it aims to enhance decision-making in trending or ranging markets, though it's reactive and best used with confirmation. Note: This is a technical tool for educational purposes only; it does not provide financial advice, guarantees of profitability, or trading recommendations. Past performance is not indicative of future results, and users should backtest thoroughly on their specific assets/timeframes, in compliance with TradingView's house rules.
Key Features
• HTF Swing Levels: Detects and draws session highs/lows from a user-selected higher timeframe (e.g., Daily), extends lines until mitigated (by wick or body close), with alerts on mitigation.
• CTF Swing Levels: Identifies local swing highs/lows on the chart timeframe using a pivot candle formation (default 5-candle), with separate limits for unmitigated/mitigated lines.
• EMA Ribbon: A three-EMA system (fast 8, mid 13, slow 21) with gradient fills (green for bullish, red for bearish) to visualize trend strength and filter signals.
• Signal Generation: Buy/sell labels ("BUY"/"SELL") triggered post-mitigation when price aligns with EMA trend (e.g., above slow EMA with stacked bulls for buys).
• Trade Simulation & Risk Management: On signals, calculates stop-loss (SL) from recent extremes, position size based on fixed risk amount (e.g., $100 per trade, adjusted for asset type like futures point value or forex lots), and full take-profit (TP) at user-defined RR level (1-5). Draws RR boxes for visuals.
• Statistics Table: Displays total trades, wins/losses, win rate (%), net R-return, and max consecutive losses in a top-right table.
• Alerts: Customizable alerts for HTF mitigations and new trades (including entry, SL, TP, size).
• Visual Customizations: Toggle lines/ribbon/boxes, adjust colors/styles/widths for unmitigated/mitigated lines (HTF/CTF), min box width.
• Performance Optimization: Automatically cleans up excess lines to stay within max limits (e.g., 15 unmitigated HTF, 5 CTF).
How It Works
• HTF Logic: On new HTF bars (via time(htf_timeframe)), captures session high/low and draws extendable lines. Lines extend rightward until mitigated (high/close > high level for highs, low/close < low level for lows, toggle wick/body). Mitigation sets "waiting" flags for signals and triggers alerts.
• CTF Logic: Scans for pivot highs/lows using a user-defined candle count (e.g., 2 left/right for 5-candle swings). Draws and extends lines similarly, mitigating on wick touches, with separate styles for mitigated (e.g., dotted gray).
• EMA Ribbon Logic: Computes 8/13/21 EMAs; fills mid-slow and fast-mid with bullish green (close > slow EMA) or bearish red gradients.
• Signal Conditions: Post-mitigation (waiting_for_buy/sell true), checks EMA stack—buys require close > slow, fast > mid > slow; sells require close < slow, fast < mid < slow. Signals only on confirmed bars.
• Trade Execution: On signal, sets entry at close, scans back to mitigation bar for tightest SL (lowest low for buys, highest high for sells). Calculates risk points (entry - SL for buys), then position size via helper function (asset-specific: e.g., XAU *100, futures *pointvalue, forex 100000pointvalue). Sets full TP at entry ± (risk * full_tp_level). Draws risk/reward boxes (e.g., long: dark risk below entry, blue reward above) with RR and size text. Alerts with trade details.
• Trade Management: Monitors for SL hit (low <= SL for longs) or TP hit (high >= TP for longs); updates stats (wins if TP, losses if SL, tracks consec losses, net R as +full_tp_level or -1). Places summary label ("Hit TP5 (Win)" or "Stopped Out (Loss)").
• Cleanup: Counts unmitigated/mitigated lines; deletes oldest excess to respect max limits (e.g., max_lines_input=15 for HTF unmitigated, max_mit_lines_ctf=5 for CTF mitigated).
• Why This Meshup?: Standalone tools often fall short—HTF swings ignore local noise, but without CTF, miss entries; EMAs filter trends but overlook structure; manual RR lacks automation. Meshing them creates a "mitigation-to-signal" flow: HTF/CTF provide structural context (e.g., BOS/CHOCH), EMA ensures trend alignment (reducing whipsaws), and RR simulation adds practical risk control with stats for optimization. This holistic approach potentially improves edge in structure-based trading, especially in volatile markets, by combining macro/micro analysis with quantifiable risk—though it may lag in ranges or require tuning.
All logic uses arrays for line management, barstate.isconfirmed for reliability, and syminfo for asset-specific sizing. No repainting, but historical trades simulate based on chart data.
Settings and Customization
Inputs are grouped for usability:
1. Higher Timeframe (HTF) Settings:
o Show HTF Lines: Toggle visibility (default: true).
o Use Wick for Mitigation: True for wick touch, false for body close (default: false; tooltip explains).
o Timeframe: HTF period (default: "D").
o Max Unmitigated HTF Lines: Limit for active lines (default: 15, min 1, max 250).
2. Current Timeframe (CTF) Settings:
o Show CTF Swings: Toggle (default: true).
o CTF Swing Candle Count: Left/right candles for pivot (default: 2, min 1; tooltip: '2' = 5-candle formation).
o Max Unmitigated CTF Lines: (default: 5, min 1, max 250).
o Max Mitigated CTF Lines: (default: 5, min 1, max 250).
3. EMA Settings:
o Show EMA Ribbon: Toggle (default: true).
o Fast/Middle/Slow EMA Length: Defaults 8/13/21.
4. Risk/Reward Settings:
o Risk Amount per Trade ($): Fixed risk (default: 100.0, min 0.1; tooltip: for position sizing).
o Full Take Profit Level (1-5): RR for full win (default: 5; tooltip: counts as win in stats).
o Show Trade Visuals & Stats: Toggle boxes, labels, table (default: true).
5. 🎨 Visuals:
o Draw Risk/Reward Box: Toggle (default: true).
o Minimum Box Width (in bars): (default: 5, min 1).
o Long - Risk/Reward Box Colors: Defaults dark gray (risk), blue (reward).
o Short - Risk/Reward Box Colors: Defaults dark gray (risk), orange (reward).
6. Alert Settings:
o Alert on HTF Level Mitigation: Toggle (default: true).
7. HTF Line Style Settings:
o High (Unmitigated): Color (maroon 20%), width (1).
o High (Mitigated): Color (gray 40%), style (dotted/dashed, default dotted).
o Low (Unmitigated): Color (teal 20%), width (1).
o Low (Mitigated): Color (gray 40%), style (dotted/dashed, default dotted).
8. CTF Line Styles:
o CTF High (Unmitigated): Color (purple #8d198d 25%), width (1), style (Solid/Dotted/Dashed, default Solid).
o CTF High (Mitigated): Color (gray 50%), width (1), style (default Dotted).
o CTF Low (Unmitigated): Color (teal #008080 25%), width (1), style (default Solid).
o CTF Low (Mitigated): Color (gray 50%), width (1), style (default Dotted).
Usage Tips
• Multi-Timeframe Strategy: Use HTF (e.g., D1) for major levels, CTF for entries. Signals post-mitigation with EMA filter—enter on "BUY"/"SELL" labels, use boxes for RR visualization.
• Risk Management: Set risk_amount_per_trade to 1-2% of capital; adjust full_tp_level for strategy (e.g., 3 for conservative). Position size auto-adapts to asset (e.g., smaller for high-vol like XAU).
• Customization: Enable wick mitigation for aggressive setups; increase max lines in trending markets. Tune EMAs for asset (shorter for crypto).
• Alerts Integration: Use for notifications on mitigations or trades; messages include all details for quick action.
• Stats Analysis: Table shows hypothetical results—use for optimization (e.g., aim for >50% win rate, low consec losses). Reset on chart reload.
• Chart Compatibility: Best on candlestick charts; test on lower TFs with higher HTF for confluence.
Limitations
• Reactive Signals: Waits for mitigation + EMA alignment, so may miss early reversals or lag in fast markets.
• Chop in Ranges: Frequent mitigations without trend can generate false signals; EMA helps but not foolproof.
• Simulation Only: Trades are backtested on visible data—no live execution; stats assume full TP or SL hits, ignoring partials or slippage.
• Line Limits: Caps at user max to prevent overload; oldest deleted first.
• Asset Specificity: Position sizing tailored to forex/futures/metals; may need tweaks for others.
• Disclaimer: For informational use only. Trading involves risk of loss; results vary by market, timeframe, and settings. Consult professionals and backtest extensively. No profitability claims per TradingView rules.

Highlight 6-7 PM (IST) candle + mark H/L (Hourly)📌 Highlight 6–7 PM Candle (IST) + High/Low Lines (No Labels)
This indicator automatically detects the 6:00–7:00 PM candle (IST) on the hourly timeframe and visually marks it on the chart.
It highlights the candle and draws horizontal High and Low levels without any labels—making the chart clean and easy to read.
✅ Features
Highlights the 6–7 PM hourly candle (timezone adjustable: IST/UTC/Exchange).
Draws high & low horizontal lines from the target candle.
Option to extend the lines for a selected number of bars.
Optional restriction to only show on 1-hour timeframe.
Clean design — no labels, no clutter.
🛠️ Inputs
Timezone (default: Asia/Kolkata)
Target Hour (default: 18 = 6 PM)
Highlight Color
High/Low Line Colors
Line Extension Length
Enable/Disable Hourly-only Mode
🎯 Use Case
Useful for traders who track post-market candles, volatility behavior, range levels, or want to build intraday strategies based on evening session highs/lows.

Momentum Master v1# Momentum Master v1 - Multi-Strategy Trading System
## SCRIPT OVERVIEW
Momentum Master v1 is a multi-strategy trading system that integrates 6 distinct trading methodologies (EMA Crossover, RSI Mean Reversion, Breakout, MACD Crossover, Bollinger Bands, Volume Breakout) through a shared risk management pipeline. This script implements a proprietary integration framework that creates synergistic value beyond what individual indicators provide, combining advanced technical analysis techniques with institutional flow analysis.
## TECHNICAL METHODOLOGY
### Multi-Strategy Signal Generation Framework
The script operates on a shared execution framework where all six trading strategies share the same risk management system, but each strategy uses its own unique entry logic:
1. **EMA Crossover System**: Detects momentum shifts using configurable fast/slow EMA periods (Standard 9/21, Fast 7/17, Slow 13/26, or Custom)
2. **RSI Mean Reversion**: Identifies overbought/oversold conditions for counter-trend opportunities
3. **Breakout Detection**: Captures price breakouts from consolidation zones
4. **MACD Crossover**: Uses MACD line crossovers to confirm trend changes
5. **Bollinger Bands**: Trades bounces from band extremes and breakouts
6. **Volume Breakout**: Confirms moves with above-average volume
**Why This Integration Creates Unique Value:**
This is not a simple indicator mashup. The proprietary integration framework creates synergistic value through:
- **Shared Risk Management**: All strategies share ATR-based stop loss calculation and multiple take profit levels (TP1-TP6 with ratios 1:2, 1:4, 1:6, 1:8, 1:10, 1:12)
- **Adaptive Confidence Scoring**: The system evaluates market context from multiple perspectives simultaneously
- **Shared Filter System**: Optional filters (RSI extremes, ADX trend strength, Volume confirmation, POC proximity) apply uniformly across all strategies
## FLOW ANALYSIS INTEGRATION
### Fair Value Gap (FVG) Retracement Validation
The script implements proprietary FVG detection with retracement validation logic:
- **200-bar lookback** with **20% ATR tolerance** for gap identification
- **Retracement confirmation**: Signals can require price to retrace into a recent FVG before entry (optional filter)
- **Size filtering**: Only displays FVGs above minimum ATR threshold (configurable)
- **Visual tracking**: Shows last N FVGs with color-coded boxes (bullish green, bearish red)
**How FVG Integration Enhances Strategy Signals:**
When a strategy generates a signal, the FVG system validates whether price has recently retraced into an institutional order flow gap. This adds a layer of confirmation that the move is supported by institutional activity, not just retail momentum.
### Order Block Detection with Directional Alignment
- **Institutional accumulation/distribution zones**: Identifies the last bullish/bearish candle before a significant move
- **Directional filter**: Optional setting to only allow trades aligned with the most recent order block direction
- **ATR-based size filtering**: Filters out noise by requiring minimum order block size
- **Visual display**: Shows order blocks as colored boxes extending N bars forward
**Integration Logic:**
Order blocks represent areas where institutions accumulated or distributed positions. When a strategy signal occurs near an order block, it indicates higher probability that the move will continue in the block's direction.
### Multi-Timeframe POC (Point of Control) Analysis
The script calculates and displays POC levels from multiple timeframes:
- **Volume Profile POC**: Highest volume price over last N bars (configurable lookback)
- **Session POC**: Point of control for current trading session
- **Daily POC**: Daily volume-weighted average price
- **Weekly POC**: Weekly volume-weighted average price (optional)
**POC Proximity Filtering:**
Optional filters allow signals only when price is within X ATR of a POC level. This ensures entries occur at statistically significant price levels where liquidity is concentrated.
## FIBONACCI EXTENSION SYSTEM
### Dynamic Fibonacci Calculation
- **Swing-based detection**: Automatically identifies swing highs and lows using configurable lookback period
- **Extension levels**: Calculates Fibonacci extension levels (0.618, 0.786, 1.0, 1.272, 1.414, 1.618, 2.0, 2.618)
- **Retracement levels**: Shows standard retracement levels (0.236, 0.382, 0.5, 0.618, 0.786)
- **Negative levels**: Optional negative Fibonacci levels (-0.27, -0.618) for extended targets
**How Fibonacci Enhances Risk Management:**
Take profit levels are automatically calculated using Fibonacci extension mathematics. The system identifies the swing structure and projects potential reversal zones, allowing traders to set targets based on mathematical probability rather than arbitrary price levels.
## LIQUIDITY ZONE DETECTION
### Buy and Sell Side Liquidity
- **Swing-based liquidity zones**: Identifies recent swing highs (sell-side liquidity) and swing lows (buy-side liquidity)
- **Configurable lookback**: Adjustable period for liquidity zone detection
- **Visual display**: Horizontal lines extending N bars forward to show liquidity targets
- **Maximum zones**: Limits display to most recent N zones to avoid chart clutter
**Trading Application:**
Liquidity zones represent areas where stop losses are likely clustered. Price often moves to "sweep" these liquidity zones before reversing, creating high-probability entry opportunities.
## RISK MANAGEMENT SYSTEM
### ATR-Based Stop Loss Calculation
- **Dynamic stop placement**: Stop loss calculated using ATR (Average True Range) with configurable multiplier
- **Adaptive to volatility**: Stop loss automatically adjusts to current market volatility conditions
- **Configurable ATR period**: Default 14-period ATR, adjustable from 5-30 periods
- **SL multiplier**: Adjustable from 0.5x to 10x ATR for different risk profiles
### Multiple Take Profit Levels
The system supports up to 6 take profit levels with fixed risk-reward ratios:
- **TP1**: 1:2 risk-reward ratio
- **TP2**: 1:4 risk-reward ratio
- **TP3**: 1:6 risk-reward ratio
- **TP4**: 1:8 risk-reward ratio (optional)
- **TP5**: 1:10 risk-reward ratio (optional)
- **TP6**: 1:12 risk-reward ratio (optional)
**Why Multiple TP Levels:**
This allows partial profit-taking at key Fibonacci extension levels while letting winners run. The system tracks win rates for each TP level, helping traders optimize their exit strategy.
## SIGNAL FILTERS (OPTIONAL ENHANCEMENTS)
### RSI Extreme Filter
- **Avoid overbought/oversold extremes**: Prevents entries when RSI is in extreme zones (default: >70 overbought, <30 oversold)
- **Configurable thresholds**: Adjustable RSI levels and calculation period
- **Purpose**: Reduces false signals in exhausted moves
### ADX Trend Strength Filter
- **Avoid choppy markets**: Only allows trades when ADX indicates trending conditions (default: ADX > 20)
- **Configurable threshold**: Adjustable ADX minimum value (10-50)
- **Purpose**: Filters out low-probability trades in ranging markets
### Volume Confirmation
- **Volume multiplier**: Requires volume above X times average (default: 1.1x)
- **Purpose**: Ensures moves are supported by institutional participation
### POC Proximity Filters
- **Volume POC filter**: Only enter when price is near Volume Profile POC
- **Session POC filter**: Only enter when price is near Session POC
- **Daily POC filter**: Only enter when price is near Daily POC
- **Weekly POC filter**: Only enter when price is near Weekly POC
- **Proximity threshold**: Configurable ATR multiplier for "near" definition (default: 2.0x ATR)
---
## DIVERGENCE DETECTION
### MFI (Money Flow Index) Divergence
- **Bullish divergence**: Price makes lower low, MFI makes higher low (potential reversal up)
- **Bearish divergence**: Price makes higher high, MFI makes lower high (potential reversal down)
- **Configurable lookback**: Adjustable period for divergence detection (default: 100 bars)
- **Minimum bars between divergences**: Prevents duplicate signals (default: 10 bars)
- **Advanced thresholds**: Separate thresholds for RSI, price, and MFI divergence strength
**Note**: Divergence detection is visual-only and does not filter trades. It provides additional market context for discretionary traders.
## MARKET CONTEXT TOOLS
### Session High/Low Lines
- **Recent session extremes**: Displays horizontal lines for session high and low
- **Configurable lookback**: Adjustable period for session calculation (default: 10 bars)
- **Purpose**: Identifies key intraday support/resistance levels
### Swing Point Detection
- **Automatic swing identification**: Marks significant swing highs and lows
- **Visual reference**: Helps identify market structure and trend direction
### Signal Overview Table
Real-time technical analysis overview:
- **Current RSI**: Relative Strength Index value
- **ATR**: Current Average True Range
- **ADX**: Average Directional Index (trend strength)
- **EMA status**: Current fast/slow EMA relationship (Bullish/Bearish/Neutral)
- **POC levels**: Current price relative to POC levels
- **Confidence score**: Calculated confidence percentage based on confluence
- **Volume trend**: Current volume trend direction
## CHART DISPLAY OPTIONS
### Entry/SL/TP Lines
- **Visual trade management**: Displays entry price, stop loss, and all take profit levels as horizontal lines
- **Configurable length**: Lines extend N bars forward (default: 30 bars)
- **Color-coded**: Different colors for entry, stop loss, and each TP level
### Win/Loss Labels
- **Trade verification**: Displays up to 500 individual win/loss labels on chart
- **Visual feedback**: Green labels for wins, red labels for losses
- **Performance tracking**: Helps verify strategy performance visually
## USAGE INSTRUCTIONS
### Initial Setup
1. **Select Strategy Mode**: Choose your preferred trading strategy from the dropdown (EMA Crossover, RSI Mean Reversion, Breakout, MACD Crossover, Bollinger Bands, Volume Breakout, or Disabled)
2. **Configure Risk Management**:
- Set ATR Length for stop loss calculation (default: 14)
- Set SL ATR Multiplier (default: 1.0)
- Enable additional TP levels if desired (TP4-TP6 are optional)
3. **Adjust Strategy Parameters**: Each strategy has its own settings group. Configure EMA periods, RSI settings, MACD parameters, etc., based on your selected strategy.
### Recommended Settings by Market Type
**Forex/Crypto (High Volatility)**:
- EMA Mode: Fast (7/17) or Custom (3/21)
- SL ATR Multiplier: 1.5-2.0
- Enable FVG retracement filter
- Enable Order Block directional filter
**Stocks (Moderate Volatility)**:
- EMA Mode: Standard (9/21)
- SL ATR Multiplier: 1.0-1.5
- Enable ADX filter to avoid choppy markets
- Enable Volume confirmation
**Indices (Lower Volatility)**:
- EMA Mode: Slow (13/26)
- SL ATR Multiplier: 0.8-1.2
- Enable POC proximity filters
- Enable RSI extreme filter
### Advanced Configuration
1. **Enable Optional Filters**: Navigate to "Signal Filters" section and enable filters that match your trading style
2. **Configure Market Analysis Tools**: Adjust FVG, Order Block, Fibonacci, and POC settings in their respective sections
3. **Customize Display**: Toggle chart display options to show/hide various elements based on your preference
---
## WHY THIS INDICATOR COMBINATION CREATES UNIQUE VALUE
### Multi-Layered Confluence Analysis
This script is not a simple indicator mashup. It implements a proprietary integration framework that creates synergistic value through three layers of analysis:
**Layer 1: Fibonacci Mathematics**
- Golden Zone identification (61.8%-78.6% retracement zone) using three-point trend-based calculation
- Extension targets based on swing structure mathematics
- Statistically significant retracement areas where price is likely to reverse
**Layer 2: Institutional Flow Analysis**
- Fair Value Gaps (FVGs) identify order flow gaps where price must return
- Order Blocks mark institutional accumulation/distribution zones
- Multi-timeframe POC analysis shows where liquidity is concentrated
- Liquidity zones identify where stop losses cluster
**Layer 3: Multi-Strategy Signal Generation**
- Six different entry methodologies provide multiple perspectives
- Shared risk management ensures consistent position sizing
- Adaptive confidence scoring evaluates confluence from all three layers
- Optional filters allow customization for different market conditions
### Proprietary Integration Framework
The unique value comes from how these components work together:
1. **Strategy generates signal** → 2. **FVG/Order Block validates institutional support** → 3. **POC confirms liquidity level** → 4. **Fibonacci provides target zones** → 5. **Risk management calculates optimal SL/TP placement**
This creates a complete trading system, not just a collection of indicators.
---
## TECHNICAL SPECIFICATIONS
- **Pine Script Version**: v6
- **Chart Type**: Overlay (displays on price chart)
- **Max Bars Back**: 5000 (for historical analysis)
- **Max Labels**: 500 (for win/loss tracking)
- **Compatibility**: Works on all timeframes and instruments
- **Performance**: Optimized for real-time execution
---
## DISCLAIMER
This script is a technical analysis tool and does not constitute financial, investment, trading, or other types of advice. Past performance does not guarantee future results. Always use proper risk management and never risk more than you can afford to lose. The script's signals are based on mathematical calculations and should be used in conjunction with your own analysis and risk management practices.
---
## SUPPORT AND ACCESS
This is an invite-only script. To request access:
1. Visit: www.pinescriptedge.com
2. Include your TradingView username and brief trading experience
3. Access will be reviewed and granted within 24 hours
**Note**: TradingView does NOT recommend paying for or using a script unless you fully trust its author and understand how it works. You may also find free, open-source alternatives in our community scripts.
---
## VERSION INFORMATION
**Momentum Master v1** - Initial release with multi-strategy framework and institutional flow analysis integration.
For updates and new features, follow the script or check the author's profile for version announcements.

Volume Peak Box📄 English Description
Overview
The Volume Peak Box indicator highlights periods of unusually high volume by identifying volume spikes using Bollinger Bands on volume and drawing a price-range box around each spike window. This provides traders with a clear visual representation of supply/demand imbalances, absorption zones, and breakout/false-break areas.
All calculations come from one unified concept: detecting statistically significant volume peaks on a locked timeframe and mapping them onto the chart.
Concept & Logic
1. Locked Timeframe Volume Analysis
Instead of using the current chart timeframe, this script allows users to lock volume analysis to any timeframe (e.g., 60m, 4H, 1D).
The script retrieves from the chosen timeframe:
Volume
High price
Low price
This allows volume structure from higher timeframes to be used while trading lower timeframes.
2. Bollinger Bands on Volume
Volume volatility is analyzed using a standard Bollinger Band model:
Basis = SMA(volume, BB length)
Upper Band = Basis + (mult × standard deviation)
When:
Volume > Upper Band
→ This bar is classified as a Volume Peak.
This approach makes the peak detection statistically meaningful, instead of simply comparing raw volume to previous bars.
3. Peak Session Detection (Continuous Peaks Form One Box)
The script tracks continuous volume peaks:
When a peak starts → begin a session
While peaks continue → extend the session
When peaks end → session closes and a box is created
For each peak session, the script records:
Start bar index
End bar index
Highest high within the session
Lowest low within the session
These values determine the box boundaries.
This allows the indicator to group related peaks into a single price zone, instead of drawing a box for every bar.
4. Drawing the Volume Peak Box
When a session ends, the script draws:
A filled box covering the full price range
From startBar → endBar
Using user-defined:
Box fill color
Border color
Each box visually marks a region where strong participation entered the market, often signaling:
Breakout validation
Absorption zones
Supply/demand imbalance
High-activity trading decisions
How to Use
Use the boxes to identify high-volume reaction zones.
When price revisits a box:
Expect strong reactions (bounce, rejection, or absorption).
When price breaks out from a box:
Can signal continuation with momentum.
Lower-timeframe entry signals become more reliable when aligned with high-timeframe volume boxes.
Recommended to lock the TF to:
60m for intraday
4H or 1D for swing trading
Why This Script Is Original
It uses Bollinger Bands on volume, not price — a less common volatility-based method for detecting volume anomalies.
It groups continuous peaks into unified zones instead of treating each spike separately.
The ability to lock the volume analysis to a higher timeframe allows multi-timeframe volume interpretation without cluttering the chart.
Boxes give traders a clean and intuitive view of volume-based “decision zones”.
🇹🇭 Thai Description — คำอธิบายภาษาไทย
ภาพรวม
อินดิเคเตอร์ Volume Peak Box ใช้การตรวจจับ “Volume Peak” โดยใช้ Bollinger Band บน Volume แล้วสร้าง “กล่องช่วงราคา” ครอบช่วงที่มี Volume สูงผิดปกติ ทำให้เห็นบริเวณที่มีแรงซื้อขายเข้ามาอย่างชัดเจน เช่น จุด Breakout, จุด Absorption, หรือเขต Supply/Demand
แนวคิดและหลักการทำงาน
1. วิเคราะห์ Volume จาก Timeframe ที่ล็อกไว้
คุณสามารถเลือก TF ที่ต้องการให้ Volume ถูกนำมาคำนวณ เช่น 60 นาที, 4 ชั่วโมง, 1 วัน
แม้คุณจะเปิดกราฟ TF เล็ก เช่น 5m แต่กล่องยังอิง volume จาก TF ที่เลือกไว้ ทำให้ได้ “โซน Volume ใหญ่” ที่แม่นยำขึ้น
2. Bollinger Band บน Volume
ใช้ SMA + ส่วนเบี่ยงเบนมาตรฐานของ Volume เพื่อหา “จุดที่ Volume สูงกว่าปกติอย่างมีนัยสำคัญ”
เงื่อนไข Peak:
Volume > Upper Bollinger Band
นี่เป็นวิธีที่ดีกว่า “เทียบกับแท่งก่อนหน้า” เพราะคิดจากสถิติของทั้งช่วง
3. รวม Peak ต่อเนื่องเป็นกล่องเดียว
ถ้า Volume Peak เกิดต่อเนื่องหลายแท่ง:
จะถูกจับรวมเป็น Peak session เดียว
ใช้ High สูงสุด และ Low ต่ำสุดของทั้ง session
เมื่อ Peak จบ → วาดกล่องช่วงราคา
เหมาะกับการหาจุดที่ตลาดมีแรงเข้าซื้อ/ขายหนักในช่วงเวลาเดียวกัน
4. วาดกล่อง Volume Peak
กล่องจะครอบ:
ช่วงแท่งเริ่มต้น → แท่งสุดท้ายของ Peak
ความสูงของกล่อง = ช่วงราคาที่มี Volume สูงผิดปกติ
กล่องสามารถใช้เป็น:
โซน Breakout/Breakdown
โซน Supply/Demand
เขตที่ราคามักมี reaction
วิธีใช้งาน
ใช้กล่องเป็น “เขตการตัดสินใจ” (Decision Zone)
ราคาแตะซ้ำมักเกิดการกลับตัวหรือความผันผวนสูง
การทะลุกล่องบ่อยครั้งนำไปสู่ขาเทรนด์ใหญ่
เหมาะกับการใช้ร่วมกับ Price Action และโครงสร้างราคา
จุดเด่น / ความเป็น Original
ใช้ Bollinger Band บน Volume (น้อยอินดี้ทำ)
รวม Peak ต่อเนื่องเป็น session เดียว
วิเคราะห์ Volume ข้าม TF ได้ โดยไม่ต้องเปลี่ยน TF บนกราฟ
ได้ “โซน Volume สำคัญ” แบบชัดเจน อ่านง่าย ไม่รกจอ

Global Sessions by Back Ground ColorGlobal Sessions Background Color Indicator
This free TradingView tool visually highlights major global trading sessions directly on your chart using clean, professional color coding. It’s designed to help traders quickly identify periods of high liquidity and overlapping sessions, which often drive volatility and key price movements.
Features:
Session Highlights: Marks Asian, European (London), US (New York), and Overnight sessions with distinct background colors.
Overlap Detection: Special colors for overlapping sessions (e.g., London + New York).
Market Open/Close Alerts: Displays labels for major financial centers when they open or close.
Timezone-Aware: Automatically adjusts to Europe/Amsterdam (modifiable for your needs).
Clean Design: Uses a light, professional color palette for easy chart readability.
Why Use It?
Session timing is critical for spotting breakouts, reversals, and liquidity shifts. This indicator gives traders a clear visual edge without cluttering the chart—perfect for scalpers, day traders, and swing traders.
Completely free for the TradingView community – built by a trader, for traders.
How to Use the Global Sessions Indicator
This indicator automatically highlights major trading sessions on your chart using background colors. It helps you quickly identify when liquidity and volatility are likely to increase.
Color Guide:
Light Sky Blue → Asian Session (Tokyo, Sydney)
Active from 02:00 to 12:00 Amsterdam time. Often quieter but sets early trends.
Light Coral → European Session (London, Frankfurt)
Active from 09:00 to 17:30 Amsterdam time. Brings strong liquidity and trend continuation.
Light Green → US Session (New York, Chicago)
Active from 15:30 to 22:00 Amsterdam time. High volatility, major moves often occur here.
Gold/Yellow → Overnight/Wellington
Active from 23:00 to 02:00 Amsterdam time. Low liquidity, pre-Asia positioning.
Overlap Colors:
Orchid (Pinkish) → Asia + Europe Overlap
Indicates transition from Asia to London—watch for breakouts.
Light Salmon → Europe + US Overlap
The most volatile period of the day—ideal for intraday traders.
Extra Feature:
Labels show market open/close times for major financial centers (e.g., London Open, New York Close).

True Opens & Key Levels# True Opens & Key Levels - Standalone Indicator Guide
## Overview
This is a clean, focused indicator that displays only key level rays and true open levels. All impulsive series detection, FVG detection, and Fibonacci projections have been removed for a minimal, uncluttered chart experience.
---
## Features Included
### 📊 Previous Period Levels
- **Previous Day High/Low** - Daily reference points
- **Previous Week High/Low** - Weekly reference points
- **Previous Month High/Low** - Monthly reference points
### 🕐 Session High/Low Levels
- **NY AM Session** (9:30-12:00 ET) - Morning session range
- **NY Lunch Session** (12:00-13:30 ET) - Lunch hour range
- **NY PM Session** (13:30-16:00 ET) - Afternoon session range
- **London Session** (2:00-5:00 ET) - London trading hours
- **Asia Session** (20:00-00:00 ET) - Asian market hours
### 🎯 True Open Levels (NEW)
- **True Day Open** - Updates daily at 00:00 ET
- **True Session Open** - Updates every 6 hours (1:30, 7:30, 13:30, 19:30 ET)
- **True Week Open** - Updates every Monday at 18:00 ET
---
## Settings
### Key Level Rays Group
**Master Toggle:**
- Enable Key Level Rays (master on/off switch)
**Previous Period Levels:**
- Show Previous Day H/L
- Show Previous Week H/L
- Show Previous Month H/L
**Session Levels:**
- Show NY AM H/L (9:30-12:00 ET)
- Show NY Lunch H/L (12:00-13:30 ET)
- Show NY PM H/L (13:30-16:00 ET)
- Show London H/L (2:00-5:00 ET)
- Show Asia H/L (20:00-00:00 ET)
**True Open Levels:**
- Show True Day Open (00:00)
- Show True Session Open (6h intervals)
- Show True Week Open (Mon 18:00)
**Visual Settings:**
- High Level Color (default: red with 50% transparency)
- Low Level Color (default: green with 50% transparency)
- Open Level Color (default: blue with 50% transparency)
- Ray Line Width (1-5 pixels)
- Ray Label Size (tiny/small/normal/large)
---
## How It Works
### Level Behavior
**Session High/Low Levels:**
1. During session: Tracks the highest high and lowest low
2. After session ends: Draws horizontal rays extending right
3. When price hits level: Ray stops extending (hit marker)
4. Label updates position to stay at chart's right edge
**Previous Period Levels:**
1. At period change: Draws rays from previous period's H/L
2. Extends right until price hits the level
3. When hit: Ray stops extending
4. Label positions at midpoint of ray
**True Open Levels:**
1. At trigger time: Draws ray from opening price
2. Extends right until next trigger
3. Previous level is deleted when new one appears
4. Label stays at right edge of chart
---
## Color Scheme
### Three Color Categories:
1. **Red** - All HIGH levels (session highs, previous highs)
2. **Green** - All LOW levels (session lows, previous lows)
3. **Blue** - All OPEN levels (True Day/Session/Week Opens)
This makes it instantly clear what type of level you're looking at.
---
## Best Practices
### For Intraday Trading (1m-1H):
```
Enable:
✓ True Day Open
✓ True Session Open
✓ NY AM/PM H/L
✓ Previous Day H/L
Disable:
✗ Previous Week/Month H/L
✗ London/Asia sessions (unless trading them)
✗ True Week Open
```
### For Swing Trading (1H-4H):
```
Enable:
✓ True Week Open
✓ True Day Open
✓ Previous Week H/L
✓ Previous Day H/L
Disable:
✗ All session H/L
✗ True Session Open
✗ Previous Month H/L
```
### For Clean Charts:
```
Enable:
✓ True Day Open
✓ True Week Open
✓ Previous Day H/L only
Disable:
✗ Everything else
Result: Just 4 levels on chart - super clean!
```
---
## Level Update Schedule
| Level | Update Frequency | Time(s) |
|---------------------|------------------|-----------------------------|
| True Day Open | Daily | 00:00 ET |
| True Session Open | Every 6 hours | 1:30, 7:30, 13:30, 19:30 ET |
| True Week Open | Weekly | Monday 18:00 ET |
| Previous Day H/L | Daily | At day change |
| Previous Week H/L | Weekly | At week change |
| Previous Month H/L | Monthly | At month change |
| NY AM H/L | Daily | After 12:00 ET |
| NY Lunch H/L | Daily | After 13:30 ET |
| NY PM H/L | Daily | After 16:00 ET |
| London H/L | Daily | After 5:00 ET |
| Asia H/L | Daily | After 00:00 ET |
---
## File Size & Performance
- **File Size:** ~22 KB (less than half the size of full indicator)
- **Total Lines:** ~700 lines
- **Max Lines/Labels:** 500 (configurable in declaration)
- **Performance:** Lightweight, minimal CPU usage
- **Memory:** Efficient variable management
---
## Installation
1. Open TradingView
2. Open Pine Editor (Alt+E or bottom toolbar)
3. Click "Create new indicator"
4. Delete default code
5. Copy and paste contents of `TRUE_OPENS_KEY_LEVELS.pine`
6. Click "Save" and name it "True Opens & Key Levels"
7. Click "Add to Chart"
---
## Usage Tips
### 1. Start Minimal
Begin with just 2-3 levels enabled:
- True Day Open
- Previous Day High
- Previous Day Low
Add more as needed.
### 2. Color Customization
Adjust transparency for cleaner look:
- High Level: Red 60-70% transparency
- Low Level: Green 60-70% transparency
- Open Level: Blue 60-70% transparency
### 3. Multi-Timeframe Approach
Lower timeframes (1m-15m): Use True Session Open + NY session H/L
Mid timeframes (15m-1H): Use True Day Open + Previous Day H/L
Higher timeframes (1H-4H): Use True Week Open + Previous Week H/L
### 4. Line Width
For cleaner charts, use Line Width = 1
For emphasis, use Line Width = 2-3
### 5. Label Size
Smaller screens: Use "small" or "tiny"
Larger screens: Use "normal"
Presentations: Use "large"
---
## Advantages of Standalone Version
✅ **Cleaner Charts** - No detection lines or arrows
✅ **Faster Loading** - Less code to process
✅ **Easier Setup** - Fewer settings to configure
✅ **Pure Levels** - Focus only on key price levels
✅ **Less Distraction** - No moving parts during trading
✅ **Perfect for Combining** - Use with other indicators without clutter
---
## Combining with Other Indicators
This lightweight indicator works great alongside:
- RSI / Stochastic (oscillators)
- Moving Averages (trend)
- Volume Profile (structure)
- VWAP (intraday reference)
- Your own custom indicators
The minimal chart footprint leaves room for additional tools.
---
## Time Zones
All times are in **Eastern Time (ET)**. TradingView automatically converts to your local timezone, so you don't need to manually adjust anything.
**Example Conversions:**
- 00:00 ET = 05:00 UTC
- 18:00 ET = 23:00 UTC
- 13:30 ET = 18:30 UTC
---
## Support & Updates
This is a standalone version of the True Opens & Key Levels from the full GOTE Indicator. It contains only the level detection code with all series detection removed.
**Version:** 1.0
**Pine Script Version:** 6
**Last Updated:** November 8, 2025
---
## Quick Reference Card
```
╔══════════════════════════════════════════════════════════╗
║ TRUE OPENS & KEY LEVELS - QUICK REFERENCE ║
╠══════════════════════════════════════════════════════════╣
║ ║
║ 📊 PREVIOUS PERIODS ║
║ • Previous Day/Week/Month High/Low ║
║ • Updates at period change ║
║ ║
║ 🕐 SESSION LEVELS ║
║ • NY AM/Lunch/PM, London, Asia H/L ║
║ • Updates after each session ║
║ ║
║ 🎯 TRUE OPENS ║
║ • True Day: Daily 00:00 ET ║
║ • True Session: 1:30/7:30/13:30/19:30 ET ║
║ • True Week: Monday 18:00 ET ║
║ ║
║ 🎨 COLORS ║
║ • Red = Highs • Green = Lows • Blue = Opens ║
║ ║
╚══════════════════════════════════════════════════════════╝
```
---
**Ready to trade with clean, focused key levels!** 🎯
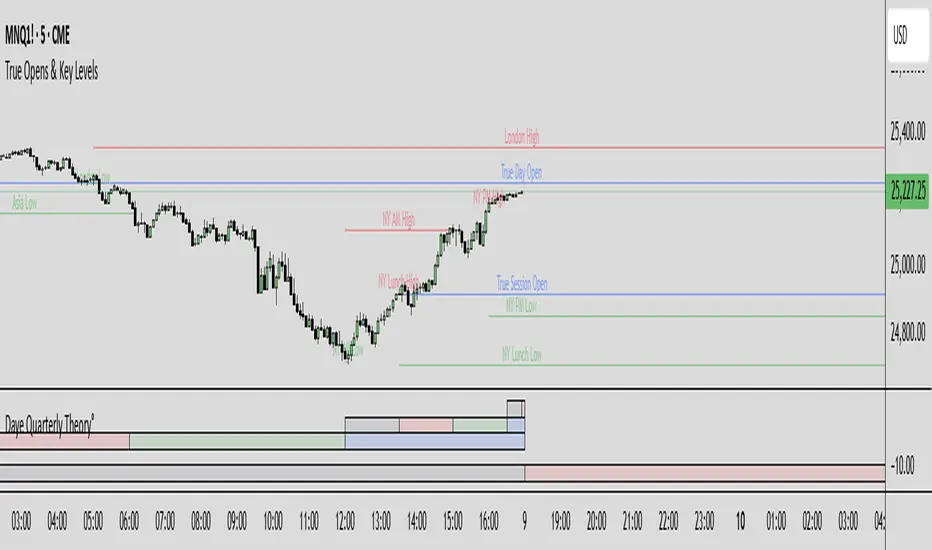
Condition Indicator – Session VWAP - Simulated BUY and SELL 🧩 Short Description (Summary):
A dual-purpose trading indicator that combines moving-average-based simulated trade zones with session VWAP structure analysis to visualize short-term market bias and potential turning points.
📘 **Full Description (for the "About" section):
Condition Indicator – Session VWAP and Simulated MA Structure
This indicator blends simulated trade logic with session-based VWAP analysis to help traders visualize when short-term and long-term market conditions align or diverge.
🧠 Key Features
Simulated Trades:
The script uses two simple moving averages (short and long) to simulate theoretical long and short trade averages over time.
It accumulates “positions” periodically (based on a user-defined minute interval) to illustrate how simulated positions would behave during trend shifts.
Session VWAP & Structure Analysis:
Calculates a dynamic VWAP and standard deviation bands for each session (daily, weekly, monthly, or hourly).
Compares price action against VWAP zones to detect whether trading volume is concentrated inside or outside equilibrium.
Support & Resistance Visualization:
Automatically identifies potential support/resistance zones based on previous session highs/lows and relative bullish or bearish volume distribution.
Market Bias Highlight:
Background color changes dynamically to represent bullish or bearish simulated conditions.
⚙️ Inputs
Long MA length / Short MA length: control the sensitivity of trend detection.
Simulated Trade Frequency: how often simulated positions are updated (in minutes).
Session Type: define the timeframe for VWAP and structure analysis (D, W, M, 60, etc.).
📈 Visualization
Red and green lines indicate simulated short/long trade averages.
VWAP line and deviation zones show session equilibrium shifts.
Background shading represents the active simulated market condition.
⚠️ Disclaimer
This script is for educational and analytical purposes only.
It is not financial advice, a trading signal, or a guaranteed strategy.
Always do your own research and consult a qualified financial professional before making trading decisions.

ICT Liquidity Sweep Asia/London 1 Trade per High & Low🧠 ICT Liquidity Sweep Asia/London — 1 Trade per High & Low
This strategy is inspired by the ICT (Inner Circle Trader) concepts of liquidity sweeps and market structure, focusing on the Asia and London sessions.
It automatically identifies liquidity grabs (sweeps) above or below key session highs/lows and enters trades with a fixed risk/reward ratio (RR).
----------------------------------------------------------------------------------
----------------------------------------------------------------------------------
⚙️ Core Logic
-Asia Session: 8:00 PM – 11:59 PM (New York time)
-London Session: 2:00 AM – 5:00 AM (New York time)
-The script marks the Asia High/Low and London High/Low ranges for each day.
-When the market sweeps above a session high → potential Short setup
-When the market sweeps below a session low → potential Long setup
-A trade is triggered when the confirmation candle closes in the opposite direction of the sweep (bearish after a high sweep, bullish after a low sweep).
-Only one trade per sweep type (1 per High, 1 per Low) is allowed per session.
----------------------------------------------------------------------------------
----------------------------------------------------------------------------------
📈 Risk Management
-Configurable Risk/Reward Target (default = 2:1)
-Configurable Position Size (number of contracts)
-Each trade uses a fixed Stop Loss (beyond the wick of the sweep) and a Take Profit calculated from the RR setting.
-All trades are automatically logged in the Strategy Tester with performance metrics.
----------------------------------------------------------------------------------
----------------------------------------------------------------------------------
💡 Features
✅ Visual session highlighting (Asia = Aqua, London = Orange)
✅ Automatic liquidity line plotting (session highs/lows)
✅ Entry & exit labels (optional visual display)
✅ Customizable RR and contract size
✅ Works on any instrument (ideal for indices, futures, or forex)
✅ Compatible with all timeframes (optimized for 1M–15M)
----------------------------------------------------------------------------------
----------------------------------------------------------------------------------
⚠️ Notes
-Best used on New York time-based charts.
-Designed for educational and backtesting purposes — not financial advice.
-Use as a foundation for further optimization (e.g., SMT confirmation, FVG filter, or time-based restrictions).
----------------------------------------------------------------------------------
----------------------------------------------------------------------------------
🧩 Recommended Use
Pair this with:
-ICT’s concepts like CISD (Change in State of Delivery) and FVGs (Fair Value Gaps)
-Higher timeframe liquidity maps
-Session bias or daily narrative filters
----------------------------------------------------------------------------------
----------------------------------------------------------------------------------
Author: jygirouard
Strategy Version: 1.3
Type: ICT Liquidity Sweep Automation
Timezone: America/New_York

BB_MES Playbook Levels + Auto Alerts (Start/TP1/TP2)Indicator Name: MES Playbook Levels + Auto Alerts (Start/TP1/TP2)
1. Indicator Overview
This is a comprehensive technical analysis tool designed for day traders, specifically for Micro E-mini S&P 500 futures (MES) but applicable to other instruments. Its primary purpose is to automate the drawing of key price levels and to provide timely alerts for a specific trading strategy, often called a "playbook" setup.
The core of the strategy involves identifying a "start" level during the regular trading session. Once the price crosses this level, the indicator automatically projects two take-profit (TP1 and TP2) targets and monitors the price action in relation to these levels.
2. Key Features
Automatic Level Plotting: The indicator plots several critical price levels on the chart, saving the trader from having to draw them manually every day.
Dynamic Start Levels: It offers two methods for establishing the bullish and bearish entry or "start" levels:
Previous Day's High/Low (PDH/PDL): The default setting uses the high and low of the prior trading day as the trigger points for long and short trades.
RTH VWAP Bands: Alternatively, it can calculate the Volume-Weighted Average Price (VWAP) that resets at the start of the Regular Trading Hours (RTH) session and create a "band" around it. The edges of this band then serve as the start levels.
Automated Take-Profit Targets: Upon a cross of a "start" level, the indicator immediately plots two take-profit lines (TP1 and TP2) based on a user-defined point value.
Trade State Management: The script intelligently manages the state of a trade. It knows when a long or short trade is active and will stop looking for new signals until the current trade is concluded (either by hitting TP2 or the end of the session).
Comprehensive Alerts: A major feature is its robust alert system. Traders can set up alerts for a wide variety of events, allowing for less screen time.
Session Highlighting: It specifically monitors the Regular Trading Hours (RTH) session and can also plot the high and low of the overnight (ON) session.
3. On-Chart Visuals
When you apply this indicator to your chart, you will see the following lines and plots:
Previous Day Levels:
PDH (Previous Day High): Plotted as a green line.
PDL (Previous Day Low): Plotted as a red line.
PDC (Previous Day Close): Plotted as a gray line.
Start Levels:
StartBull: A lime green line representing the trigger for a long trade.
StartBear: A maroon line representing the trigger for a short trade.
Take-Profit Levels:
TP1 / TP2: Teal-colored lines that appear only after a StartBull or StartBear level is crossed. TP1 is a dotted line, and TP2 is solid.
Other Levels:
RTH VWAP: A blue line showing the volume-weighted average price for the main session only.
ON High / ON Low: Orange lines showing the high and low points established outside of the RTH session.
4. How It Works: The Trading Logic
Define Session: The script first identifies the Regular Trading Hours (e.g., 9:30 AM to 4:00 PM EST).
Calculate Levels: It calculates the PDH/PDL and the RTH VWAP. Based on user input, it determines the startBullLevel (either PDH or the upper VWAP band) and the startBearLevel (either PDL or the lower VWAP band).
Wait for Signal: During the RTH session, the indicator waits for the live price (close) to cross over the startBullLevel or cross under the startBearLevel.
Initiate Trade State:
If a bullish cross occurs (longStart), it logs the entryPrice, sets the trade state to longActive, and plots the TP1 and TP2 lines above the entry price.
If a bearish cross occurs (shortStart), it does the opposite, plotting TP1 and TP2 below the entry price.
Monitor Trade: While a trade is active, it checks if the price hits TP1 or TP2.
End Trade:
When the price hits the TP2 level, the trade is considered complete. The script clears the TP lines from the chart and resets itself to look for the next start signal.
At the end of the RTH session, any active trade is automatically terminated, and all TP lines are cleared to ensure a clean slate for the next day.
5. Input Settings (Customization)
The user can customize the following parameters in the indicator's settings:
RTH Session: Define the start and end times for the main trading session.
Start from RTH VWAP band: A checkbox to switch between using PDH/PDL or the VWAP band for start levels.
VWAP band offset (pts): If using the VWAP band, this sets how many points away from the VWAP the start levels are drawn.
TP1 (pts): The number of points from the entry price to set the first take-profit target.
TP2 (pts): The number of points for the second take-profit target.
Show Overnight High/Low: A toggle to show or hide the overnight session levels.
6. Configurable Alerts
You can create alerts in TradingView for any of the following conditions generated by the script:
StartBull / StartBear: Triggers when a long or short trade is initiated.
TP1 Hit / TP2 Hit: Triggers when the price reaches the take-profit levels for both long and short trades.
Level Crosses: Separate alerts can be set for when the price crosses the PDH, PDL, PDC, RTH VWAP, ON High, or ON Low. This is useful for general market awareness.

Initial Balance Breakout Signals [LuxAlgo]The Initial Balance Breakout Signals help traders identify breakouts of the Initial Balance (IB) range.
The indicator includes automatic detection of IB or can use custom sessions, highlights top and bottom IB extensions, custom Fibonacci levels, and goes further with an IB forecast with two different modes.
🔶 USAGE
The initial balance is the price range made within the first hour of the trading session. It is an intraday concept based on the idea that high volume and volatility enter the market through institutional trading at the start of the session, setting the tone for the rest of the day.
The initial balance is useful for gauging market sentiment, or, in other words, the relationship between buyers and sellers.
Bullish sentiment: Price trades above the IB range.
Mixed sentiment: Price trades within the IB range.
Bearish sentiment: Price trades below the IB range.
The initial balance high and low are important levels that many traders use to gauge sentiment. There are two main ideas behind trading around the IB range.
IB Extreme Breakout: When the price breaks and holds the IB high or low, there is a high probability that the price will continue in that direction.
IB Extreme Rejection: When the price tries to break those levels but fails, there is a high probability that it will reach the opposite IB extreme.
This indicator is a complete Initial Balance toolset with custom sessions, breakout signals, IB extensions, Fibonacci retracements, and an IB forecast. All of these features will be explained in the following sections.
🔹 Custom Sessions and Signals
By default, sessions for Initial Balance and breakout signals are in Auto mode. This means that Initial Balance takes the first hour of the trading session and shows breakout signals for the rest of the session.
With this option, traders can use the tool for open range trading, making it highly versatile. The concept behind open range (OR) is the same as that of initial balance (IB), but in OR, the range is determined by the first minute, three or five minutes, or up to the first 30 minutes of the trading session.
As shown in the image above, the top chart uses the Auto feature for the IB and Breakouts sessions. The bottom chart has the Auto feature disabled to use custom sessions for both parameters. In this case, the first three minutes of the trading session are used, turning the tool into an Open Range trading indicator.
This chart shows another example of using custom sessions to display overnight NASDAQ futures sessions.
The left chart shows a custom session from the Tokyo open to the London open, and the right chart shows a custom session from the London open to the New York open.
The chart shows both the Asian and European sessions, their top and bottom extremes, and the breakout signals from those extremes.
🔹 Initial Balance Extensions
Traders can easily extend both extremes of the Initial Balance to display their preferred targets for breakouts. Enable or disable any of them and set the IB percentage to use for the extension.
As the chart shows, the percentage selected on the settings panel directly affects the displayed levels.
Setting 25 means the tool will use a quarter of the detected initial balance range for extensions beyond the IB extremes. Setting 100 means the full IB range will be used.
Traders can use these extensions as targets for breakout signals.
🔹 Fibonacci Levels
Traders can display default or custom Fibonacci levels on the IB range to trade retracements and assess the strength of market movements. Each level can be enabled or disabled and customized by level, color, and line style.
As we can see on the chart, after the IB was completed, prices were unable to fall below the 0.236 Fibonacci level. This indicates significant bullish pressure, so it is expected that prices will rise.
Traders can use these levels as guidelines to assess the strength of the side trying to penetrate the IB. In this case, the sellers were unable to move the market beyond the first level.
🔹 Initial Balance Forecast
The tool features two different forecasting methods for the current IB. By default, it takes the average of the last ten values and applies a multiplier of one.
IB Against Previous Open: averages the difference between IB extremes and the open of the previous session.
Filter by current day of the week: averages the difference between IB extremes and the open of the current session for the same day of the week.
This feature allows traders to see the difference between the current IB and the average of the last IBs. It makes it very easy to interpret: if the current IB is higher than the average, buyers are in control; if it is lower than the average, sellers are in control.
For example, on the left side of the chart, we can see that the last day was very bullish because the IB was completely above the forecasted value. This is the IB mean of the last ten trading days.
On the right, we can see that on Monday, September 15, the IB traded slightly higher but within the forecasted value of the IB mean of the last ten Mondays. In this case, it is within expectations.
🔶 SETTINGS
Display Last X IBs: Select how many IBs to display.
Initial Balance: Choose a custom session or enable the Auto feature.
Breakouts: Enable or disable breakouts. Choose custom session or enable the Auto feature.
🔹 Extensions
Top Extension: Enable or disable the top extension and choose the percentage of IB to use.
Bottom extension: Enable or disable the bottom extension and choose the percentage of IB to use.
🔹 Fibonacci Levels
Display Fibonacci: Enable or disable Fibonacci levels.
Reverse: Reverse Fibonacci levels.
Levels, Colors & Style
Display Labels: Enable or disable labels and choose text size.
🔹 Forecast
Display Forecast: Select the forecast method.
- IB Against Previous Open: Calculates the average difference between the IB high and low and the previous day's IB open price.
- Filter by Current Day of Week: Calculates the average difference between the IB high and low and the IB open price for the same day of the week.
Forecast Memory: The number of data points used to calculate the average.
Forecast Multiplier: This multiplier will be applied to the average. Bigger numbers will result in wider predicted ranges.
Forecast Colors: Choose from a variety of colors.
Forecast Style: Choose a line style.
🔹 Style
Initial Balance Colors
Extension Transparency: Choose the extension's transparency. 0 is solid, and 100 is fully transparent.

ICT Killzones x FVGs @dancizyeaaICT Killzones x FVGs Indicator
Last update: 19-SEP-2025
Creator: dancizyeaa
This indicator targets key session highs and lows combined with Fair Value Gaps (FVGs) visualization on TradingView charts. It integrates multiple market sessions (Asia, London, New York), drawing killzones, session separators, and key price levels with user-configurable alerts and filtering. It supports dynamic timeframe limits, coloring by FVG size, moving averages, and labels.
The ICT Killzones x FVGs indicator highlights major session high and low price zones with added fair value gaps, assisting traders in identifying potential reversal or breakout areas. It automatically draws session lines, pivot points, and dynamically colors FVG rectangles by size. It includes options for timezone offsets, alert setups for pivot breaks, and versatile visual configuration for clear session segmentation and market structure awareness.
Detailed Function Descriptions
Session Time and Date Handling:
Manages time offsets and date components to correctly align session boundaries and day separators considering timezone differences, including a weekday naming system for chart labeling.
FVG Detection and Coloring:
Detects bullish and bearish Fair Value Gaps based on recent candles, calculates gap size, and colors gaps differently if they are small or normal size to highlight relevant market inefficiencies.
Killzone (Session High/Low Zone) Management:
Creates and updates boxes, lines, and labels representing important market session zones from Asia to New York, including the ability to extend or limit these objects across timeframes and manage range averages.
Pivot Points and Midpoint Labels:
Draws session-specific pivot highs/lows and optional midpoint lines with alert conditions when these levels are broken, allowing traders to track and be notified of key market moves.
Session Separators and Open Lines:
Draws vertical and horizontal lines marking daily, weekly, and monthly open prices and session start/end boundaries with customizable styling, enhancing chart structure clarity.
Moving Average Overlay:
Optionally plots a user-defined simple moving average line for trend analysis, with customizable length and color.
Alert System:
Provides user-configurable alerts on pivot breaks and other key events, ensuring timely trading signals.
User Inputs and Settings:
Extensive input options to customize timezone offset, session visibility, line styles, transparency, label sizes and positions, and filter parameters for FVGs for a tailored trading experience.

Indian market session on Gift Nifty chartsGift Nifty Market Session Highlighter
This indicator highlights the official Indian market session on Gift Nifty charts — from 9:15 AM to 3:30 PM IST. It shades the background during this time window so traders can instantly identify when the local market is open.
Features:
Marks 9:15 AM to 3:30 PM (IST) session on intraday charts.
Adjustable highlight color and transparency.
Works seamlessly across lower timeframes (1m, 5m, 15m, etc.).
Helps traders align Gift Nifty activity with NSE market hours.
Use Cases:
Quickly distinguish active market hours from overnight or global sessions.
Backtest trading strategies specific to Indian session volatility.
Improv
e focus on expiry-day setups and intraday opportunities.
Disclaimer:
This tool is provided for educational and informational purposes only. It is not financial advice, nor does it guarantee trading success. Always do your own research and consult a licensed financial professional before making investment decisions.
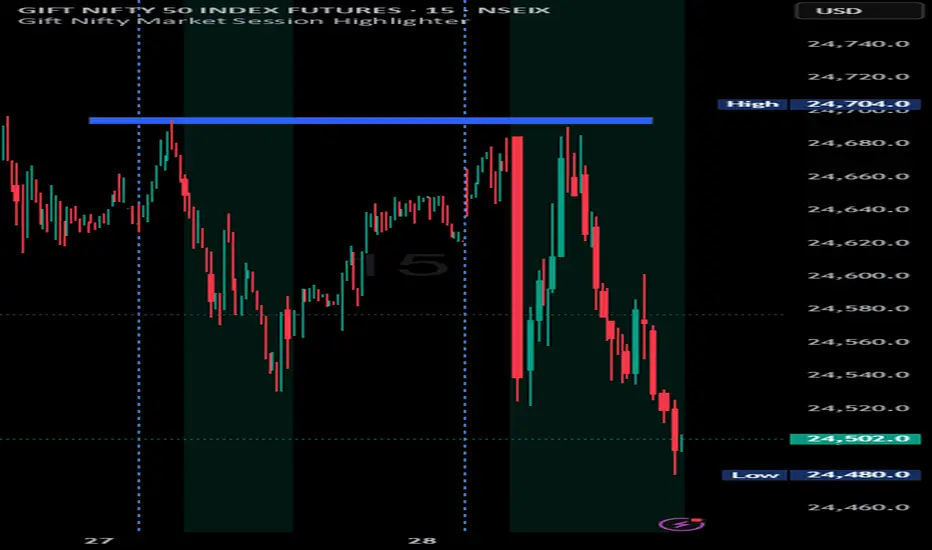
ORB Breakouts with alerts"ORB Breakouts with Alerts" is a utility indicator that highlights an Opening Range Breakout (ORB) setup during a user-defined intraday time window. It allows traders to visualize price consolidation ranges and receive alerts when price breaks above or below the session high/low.
🔧 Features:
*Customizable session time (start and end), adjustable to local time using a timezone offset.
*Automatically plots:
*A shaded box around the session's high and low.
*Horizontal lines at session high and low levels.
*Optional "BUY"/"SELL" labels to mark breakout directions.
*Visual breakout signals when price crosses above or below the session range.
*Built-in alerts to notify when breakouts occur.
*Configurable styling options including box color, highlight color, and label placement.
⚙️ How It Works:
*During the defined time range, the script tracks the highest high and lowest low.
*After the session ends:
*A box is drawn to represent the opening range.
*Breakouts above the high or below the low trigger visual markers and optional alerts.
*Alerts are limited to one per direction per day to reduce noise.
⚠️ This indicator is a technical analysis tool only and does not provide financial advice or trade recommendations. Always use with proper risk management and in conjunction with your trading plan.

Key Session & LevelsThis indicator helps traders track key price levels for multiple timeframes and trading sessions. It plots:
Previous Day's High and Low (PD): Highlighting the high and low of the previous trading day.
Previous Week's High and Low (PW): Plotting the highest and lowest price levels for the past week.
Tokyo Session High and Low (Today): Displays the high and low levels for the Tokyo trading session (adjustable to your preferred time window).
London Session High and Low (Today): Tracks the high and low for the London trading session (also adjustable for your timezone and desired session window).
Features:
Customizable Time Zones: The indicator uses your preferred timezone to calculate session highs/lows.
Extendable Lines: Lines for each level extend to the right of the chart, providing continuous reference throughout the trading day.
Adjustable Settings: Fine-tune the visibility and width of the lines, and choose which levels to display (Previous Day, Previous Week, Tokyo, and London sessions).
Non-Repainting: This script uses historical data and only updates when new bars are confirmed, ensuring accurate and reliable signals.
Whether you're a day trader, swing trader, or just tracking key levels for strategic entries and exits, this tool provides quick visual reference to important price points across different trading sessions.
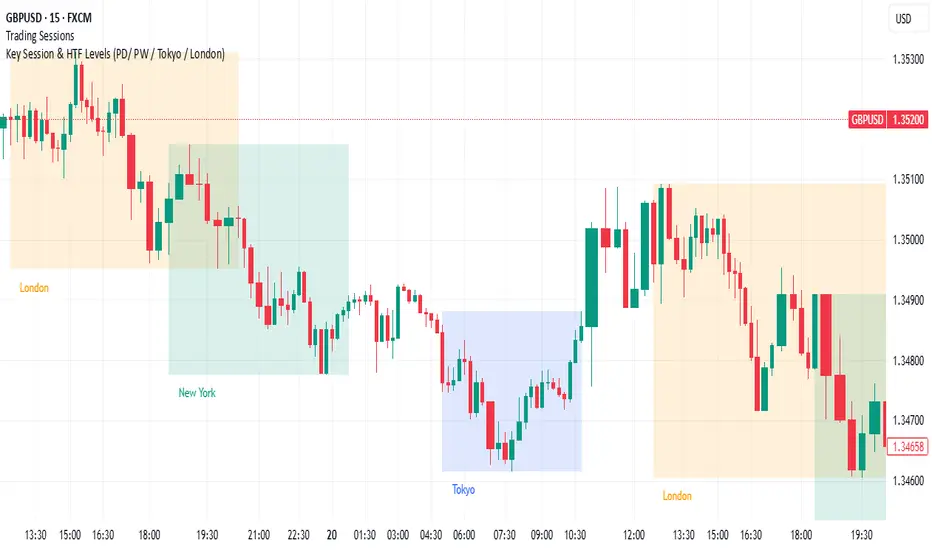